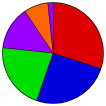
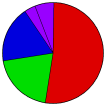
| |
Candidate | Home State | Caucus Result | Primary Vote | Delegates |
 | William J. Clinton | Arkansas | 34,899 | 29.5% |
10,544,406 |
52.04% |
0 |
0.0% |
 | Edmund G. Brown | California | 25,330 | 21.4% |
4,066,482 |
20.07% |
0 |
0.0% |
 | Paul E. Tsongas | Massachusetts | 30,147 | 25.5% |
3,647,462 |
18.00% |
0 |
0.0% |
 | Uncommitted | - | 16,313 | 13.8% |
726,376 |
3.59% |
0 |
0.0% |
 | Robert Kerrey | Nebraska | 1,983 | 1.7% |
318,944 |
1.57% |
0 |
0.0% |
 | Tom Harkin | Iowa | 9,320 | 7.9% |
280,057 |
1.38% |
0 |
0.0% |
 | Lyndon H. La Rouche, Jr. | Virginia | 0 | 0.0% |
154,690 |
0.76% |
0 |
0.0% |
 | Eugene J. McCarthy | Virginia | 0 | 0.0% |
108,679 |
0.54% |
0 |
0.0% |
 | Charles Woods | Nevada | 0 | 0.0% |
89,032 |
0.44% |
0 |
0.0% |
 | Write-ins | - | 0 | 0.0% |
76,338 |
0.38% |
0 |
0.0% |
 | Larry Agran | California | 32 | 0.0% |
58,630 |
0.29% |
0 |
0.0% |
 | H. Ross Perot | - | 0 | 0.0% |
50,305 |
0.25% |
0 |
0.0% |
 | Ralph Nader | Connecticut | 0 | 0.0% |
35,935 |
0.18% |
0 |
0.0% |
 | Louis Stokes | 0 | 0 | 0.0% |
29,983 |
0.15% |
0 |
0.0% |
 | Angus W. McDonald | West Virginia | 0 | 0.0% |
9,900 |
0.05% |
0 |
0.0% |
 | J. Louis McAlpine | 0 | 0 | 0.0% |
7,924 |
0.04% |
0 |
0.0% |
 | George W. Benns | Maryland | 0 | 0.0% |
7,888 |
0.04% |
0 |
0.0% |
 | Rufus Higginbotham | Texas | 0 | 0.0% |
7,708 |
0.04% |
0 |
0.0% |
 | Tom Howard Hawks | 0 | 0 | 0.0% |
7,434 |
0.04% |
0 |
0.0% |
 | Stephen Burke | New York | 0 | 0.0% |
5,261 |
0.03% |
0 |
0.0% |
 | Tom Laughlin | California | 0 | 0.0% |
5,202 |
0.03% |
0 |
0.0% |
 | Tom Shiekman | Florida | 0 | 0.0% |
4,975 |
0.02% |
0 |
0.0% |
 | Jeffrey Marsh | 0 | 0 | 0.0% |
2,446 |
0.01% |
0 |
0.0% |
 | George H. Ballard, III | 0 | 0 | 0.0% |
2,067 |
0.01% |
0 |
0.0% |
 | Ralph Spelbring | Indiana | 0 | 0.0% |
1,626 |
0.01% |
0 |
0.0% |
 | Robert F. Hanson | 0 | 0 | 0.0% |
1,473 |
0.01% |
0 |
0.0% |
 | Bob Cunningham | 0 | 0 | 0.0% |
1,369 |
0.01% |
0 |
0.0% |
 | Gary Hauptli | 0 | 0 | 0.0% |
1,303 |
0.01% |
0 |
0.0% |
 | Ray Rollinson | 0 | 0 | 0.0% |
1,206 |
0.01% |
0 |
0.0% |
 | Don Beamgard | 0 | 0 | 0.0% |
1,009 |
0.00% |
0 |
0.0% |
 | John A. Barnes | 0 | 0 | 0.0% |
892 |
0.00% |
0 |
0.0% |
 | Mary Jane Rachner | 0 | 0 | 0.0% |
620 |
0.00% |
0 |
0.0% |
 | Raymond J. Vanskiver | 0 | 0 | 0.0% |
510 |
0.00% |
0 |
0.0% |
 | William D. Pawley, Jr. | 0 | 0 | 0.0% |
364 |
0.00% |
0 |
0.0% |
 | William Kreml | 0 | 0 | 0.0% |
336 |
0.00% |
0 |
0.0% |
 | Susan Carole Fey | 0 | 0 | 0.0% |
308 |
0.00% |
0 |
0.0% |
 | Jim Hayes | 0 | 0 | 0.0% |
279 |
0.00% |
0 |
0.0% |
 | Lawrence D. Wilder | Virginia | 0 | 0.0% |
244 |
0.00% |
0 |
0.0% |
 | Leonard Dennis Talbow | 0 | 0 | 0.0% |
202 |
0.00% |
0 |
0.0% |
 | Curly Thornton | 0 | 0 | 0.0% |
178 |
0.00% |
0 |
0.0% |
 | John J. Staradumsky | 0 | 0 | 0.0% |
168 |
0.00% |
0 |
0.0% |
 | Nathan J. Averick | Illinois | 0 | 0.0% |
112 |
0.00% |
0 |
0.0% |
 | Other | - |
414 |
0.3% |
0 |
0.00% |
0 |
0.0% | | Total | 20,260,323 | | 0 | |  | Map Key
| > 20% |
 |  |  |  |
| > 30% |
 |  |  |  |
| > 40% |
 |  |  |  |
| > 50% |
 |  |  |  |
| > 60% |
 |  |  |  |
| > 70% |
 |  |  |  |
| > 90% |
 |  |  |  |
|
 |  |  |
|


 1992 Presidential Democratic Primary Election Results


