| |
Presidential
Candidate | Home State | Political
Party | Primary Vote | Delegates |
 | Barack Obama | Illinois | Democratic |
294,898 |
55.42% | 25 | 46.3% |
 | Hillary Clinton | New York | Democratic |
140,990 |
26.49% | 12 | 22.2% |
 | John Edwards | North Carolina | Democratic |
93,801 |
17.63% | 8 | 14.8% |
 | Other (+) | - | Democratic |
2,462 |
0.46% | 0 | 0% |
 | Unallocated | - | Democratic |
- |
- | 9 | 16.7% |
 |
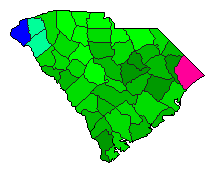
Map Key
| > 30% |
 |
 |  |
| > 40% |
|
 |  |
| > 50% |
|
|  |
| > 60% |
|
|  |
| > 70% |
|
|  |
| Turnout
 |  |  |
|
|
| | Election Information: | | Contest Type: | Party-run Primary | | Election Date: | 2008-01-26 | | Eligible Participants: | Open (all voters) | | Delegates Awarded in this Contest: | 45 | | Delegates Total: | 54 | | Delegate Allocation Method: Proportional - the candidates are awarded delegates in proportion to the percentage of votes received. A 15% threshold is required to receive delegates. |
- 16 at-large delegates
- 29 district delegates
- 9 unpledged delegates
- Congressional District 1: 4 delegates
- Congressional District 2: 5 delegates
- Congressional District 3: 4 delegates
- Congressional District 4: 4 delegates
- Congressional District 5: 6 delegates
- Congressional District 6: 6 delegates
|
|
| Demographic Data
| 2010 Population: | 4,625,364 | Enum. | 2010 Population Density: | 59.3 | persons/km2 | | 2008 Population: | 4,528,996 | Est. | 2008 Population Density: | 58.1 | persons/km2 | | 2000 Population: | 4,012,012 | Enum. | 2000 Population Density: | 51.4 | persons/km2 | | Total Delegates: | 54.0 | | Delegates Density: | 83,870 | persons/Del | | Land Area (2000): | 77,983 | km2 | Annual Pop Growth Rate: | 1.4 | % |
| Election Data and Statistics:
| Election Tools
|
| |


