| |
Presidential
Candidate | Home State | Political
Party | Caucus Result | Delegates |
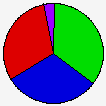
 | Barack Obama | Illinois | Democratic |
4,707 |
34.91% | 0 | 0.0% |
 | John Edwards | North Carolina | Democratic |
4,207 |
31.20% | 0 | 0.0% |
 | Hillary Clinton | New York | Democratic |
4,103 |
30.43% | 0 | 0.0% |
 | Bill Richardson | New Mexico | Democratic |
301 |
2.23% | 0 | 0.0% |
| Joe Biden | Delaware | Democratic |
147 |
1.09% | 0 | 0.0% |
| Other (+) | - | Democratic |
20 |
0.15% | 0 | 0% |
 |
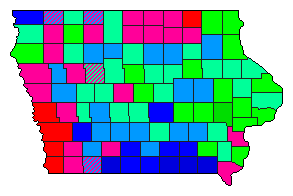
Map Key
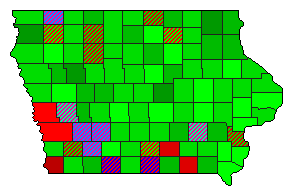
| Turnout
 |  |  |
|
|
| | Election Information: | | Contest Type: | Party-run Caucus/Convention | | Caucus Date: | 2008-01-03 | | Eligible Participants: | Closed (only members of the party) | | Delegates Awarded in this Contest: | 0 | | Delegates Total: | 57 | | Delegate Allocation Method: Proportional - the candidates are awarded delegates in proportion to the percentage of votes received. A 15% threshold is required to receive delegates. |
- No actual convention delegates are awarded at the caucuses, rather each precinct caucus chooses delegates to attend the County Convention.
- Caucus Result shown above is the number of County Convention Delegates each candidate won in the precinct caucuses.
- Current Delegate Count is only an estimate. Actual Delegates are chosen at the State Convention in June
- 29 district delegates chosen at District Conventions on April 26
- 16 at-large delegates chosen at the State Convention on June 14
- 12 Unpledged delegates
- Congressional District 1: 6 delegates
- Congressional District 2: 7 delegates
- Congressional District 3: 6 delegates
- Congressional District 4: 6 delegates
- Congressional District 5: 4 delegates
|
|
| Demographic Data
| 2010 Population: | 3,046,355 | Enum. | 2010 Population Density: | 21.1 | persons/km2 | | 2008 Population: | 3,016,734 | Est. | 2008 Population Density: | 20.8 | persons/km2 | | 2000 Population: | 2,926,324 | Enum. | 2000 Population Density: | 20.2 | persons/km2 | | Total Delegates: | 0.0 | | Delegates Density: | | persons/Del | | Land Area (2000): | 144,701 | km2 | Annual Pop Growth Rate: | 0.4 | % |
| Election Data and Statistics:
| Election Tools
|
| |


