| |
Presidential
Candidate | Home State | Political
Party | Primary Vote | Delegates |
 | Hillary Clinton | New York | Democratic |
459,511 |
65.48% | 37 | 61.7% |
 | Barack Obama | Illinois | Democratic |
209,954 |
29.92% | 14 | 23.3% |
 | Uncommitted | - | Democratic |
18,091 |
2.58% | 0 | 0.0% |
| John Edwards | North Carolina | Democratic |
14,212 |
2.03% | 0 | 0.0% |
 | Unallocated | - | Democratic |
- |
- | 9 | 15.0% |
 |
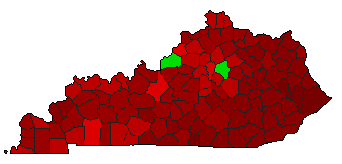
Map Key
| > 50% |
 |
 |  |
| > 60% |
 |
| |
| > 70% |
 |
| |
| > 80% |
 |
| |
| > 90% |
 |
| |
| Turnout
 |  |  |
|
|
| | Election Information: | | Contest Type: | State-run Primary | | Election Date: | 2008-05-20 | | Eligible Participants: | Closed (only members of the party) | | Delegates Awarded in this Contest: | 51 | | Delegates Total: | 60 | | Delegate Allocation Method: Proportional - the candidates are awarded delegates in proportion to the percentage of votes received. A 15% threshold is required to receive delegates. |
- 17 at-large delegates
- 34 district delegates
- 9 unpledged delegates
- Congressional District 1: 5 delegates
- Congressional District 2: 4 delegates
- Congressional District 3: 7 delegates
- Congressional District 4: 5 delegates
- Congressional District 5: 4 delegates
- Congressional District 6: 6 delegates
|
|
| Demographic Data
| 2010 Population: | 4,339,367 | Enum. | 2010 Population Density: | 42.2 | persons/km2 | | 2008 Population: | 4,289,878 | Est. | 2008 Population Density: | 41.7 | persons/km2 | | 2000 Population: | 4,041,769 | Enum. | 2000 Population Density: | 39.3 | persons/km2 | | Total Delegates: | 60.0 | | Delegates Density: | 71,498 | persons/Del | | Land Area (2000): | 102,896 | km2 | Annual Pop Growth Rate: | 0.7 | % |
| Election Data and Statistics:
| Election Tools
|
| |


