| |
Presidential
Candidate | Home State | Political
Party | Primary Vote | Delegates |
 | Barack Obama | Illinois | Democratic |
532,665 |
60.66% | 42 | 42.4% |
 | Hillary Clinton | New York | Democratic |
314,211 |
35.78% | 28 | 28.3% |
 | Uncommitted | - | Democratic |
11,417 |
1.30% | 0 | 0.0% |
| John Edwards | North Carolina | Democratic |
10,506 |
1.20% | 0 | 0.0% |
| Joe Biden | Delaware | Democratic |
3,776 |
0.43% | 0 | 0.0% |
| Other (+) | - | Democratic |
5,599 |
0.64% | 0 | 0% |
 | Unallocated | - | Democratic |
- |
- | 29 | 29.3% |
 |
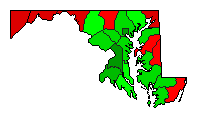
Map Key
| Turnout
 |  |  |
|
|
| | Election Information: | | Contest Type: | State-run Primary | | Election Date: | 2008-02-12 | | Eligible Participants: | Closed (only members of the party) | | Delegates Awarded in this Contest: | 70 | | Delegates Total: | 99 | | Delegate Allocation Method: Proportional - the candidates are awarded delegates in proportion to the percentage of votes received. A 15% threshold is required to receive delegates. |
- 24 at-large delegates
- 46 district delegates
- 29 unpledged delegates
- Congressional District 1: 5 delegates
- Congressional District 2: 5 delegates
- Congressional District 3: 6 delegates
- Congressional District 4: 7 delegates
- Congressional District 5: 6 delegates
- Congressional District 6: 4 delegates
- Congressional District 7: 6 delegates
- Congressional District 8: 7 delegates
|
|
| Demographic Data
| 2010 Population: | 5,773,552 | Enum. | 2010 Population Density: | 228.1 | persons/km2 | | 2008 Population: | 5,684,965 | Est. | 2008 Population Density: | 224.6 | persons/km2 | | 2000 Population: | 5,296,486 | Enum. | 2000 Population Density: | 209.2 | persons/km2 | | Total Delegates: | 99.0 | | Delegates Density: | 57,424 | persons/Del | | Land Area (2000): | 25,314 | km2 | Annual Pop Growth Rate: | 0.9 | % |
| Election Data and Statistics:
| Election Tools
|
| |


