| |
Presidential
Candidate | Home State | Political
Party | Caucus Result | Delegates |
 | Barack Obama | Illinois | Democratic |
142,109 |
66.39% | 48 | 54.5% |
 | Hillary Clinton | New York | Democratic |
68,994 |
32.23% | 24 | 27.3% |
 | Uncommitted | - | Democratic |
1,312 |
0.61% | 0 | 0.0% |
| John Edwards | North Carolina | Democratic |
985 |
0.46% | 0 | 0.0% |
| Other (+) | - | Democratic |
666 |
0.31% | 0 | 0% |
 | Unallocated | - | Democratic |
- |
- | 16 | 18.2% |
 |
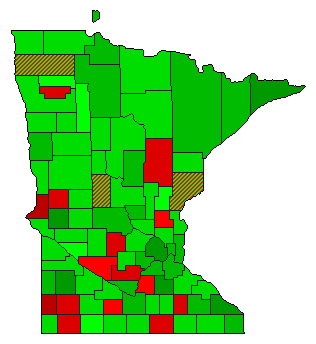
Map Key
| Turnout
 |  |  |
|
|
| | Election Information: | | Contest Type: | Party-run Caucus/Convention | | Caucus Date: | 2008-02-05 | | Eligible Participants: | Open (all voters) | | Delegates Awarded in this Contest: | 78 | | Delegates Total: | 88 | | Delegate Allocation Method: Proportional - the candidates are awarded delegates in proportion to the percentage of votes received. A 15% threshold is required to receive delegates. |
- 25 at-large delegates
- 47 district delegates
- 16 unpledged delegates
- Congressional District 1: 5 delegates
- Congressional District 2: 5 delegates
- Congressional District 3: 6 delegates
- Congressional District 4: 7 delegates
- Congressional District 5: 8 delegates
- Congressional District 6: 5 delegates
- Congressional District 7: 5 delegates
- Congressional District 8: 6 delegates
|
|
| Demographic Data
| 2010 Population: | 5,303,925 | Enum. | 2010 Population Density: | 25.7 | persons/km2 | | 2008 Population: | 5,247,018 | Est. | 2008 Population Density: | 25.4 | persons/km2 | | 2000 Population: | 4,919,479 | Enum. | 2000 Population Density: | 23.9 | persons/km2 | | Total Delegates: | 88.0 | | Delegates Density: | 59,625 | persons/Del | | Land Area (2000): | 206,189 | km2 | Annual Pop Growth Rate: | 0.8 | % |
| Election Data and Statistics:
| Election Tools
|
| |


