| |
Presidential
Candidate | Home State | Political
Party | Primary Vote | Delegates |
 | Barack Obama | Illinois | Democratic |
265,502 |
61.15% | 20 | 50.0% |
 | Hillary Clinton | New York | Democratic |
159,221 |
36.67% | 13 | 32.5% |
 | John Edwards | North Carolina | Democratic |
3,933 |
0.91% | 0 | 0.0% |
| Joe Biden | Delaware | Democratic |
1,816 |
0.42% | 0 | 0.0% |
| Bill Richardson | New Mexico | Democratic |
1,396 |
0.32% | 0 | 0.0% |
| Other (+) | - | Democratic |
2,284 |
0.53% | 0 | 0% |
 | Unallocated | - | Democratic |
- |
- | 7 | 17.5% |
 |
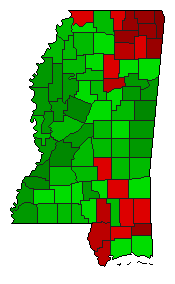
Map Key
| Turnout
 |  |  |
|
|
| | Election Information: | | Contest Type: | State-run Primary | | Election Date: | 2008-03-11 | | Eligible Participants: | Open (all voters) | | Delegates Awarded in this Contest: | 33 | | Delegates Total: | 40 | | Delegate Allocation Method: Proportional - the candidates are awarded delegates in proportion to the percentage of votes received. A 15% threshold is required to receive delegates. |
- 11 at-large delegates
- 22 district delegates
- 7 unpledged delegates
- Congressional District 1: 5 delegates
- Congressional District 2: 7 delegates
- Congressional District 3: 5 delegates
- Congressional District 4: 5 delegates
|
|
| Demographic Data
| 2010 Population: | 2,967,297 | Enum. | 2010 Population Density: | 24.4 | persons/km2 | | 2008 Population: | 2,947,806 | Est. | 2008 Population Density: | 24.3 | persons/km2 | | 2000 Population: | 2,844,658 | Enum. | 2000 Population Density: | 23.4 | persons/km2 | | Total Delegates: | 40.0 | | Delegates Density: | 73,695 | persons/Del | | Land Area (2000): | 121,488 | km2 | Annual Pop Growth Rate: | 0.4 | % |
| Election Data and Statistics:
| Election Tools
|
| |


