| |
Presidential
Candidate | Home State | Political
Party | Primary Vote | Delegates |
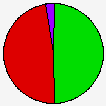
 | Barack Obama | Illinois | Democratic |
406,917 |
49.32% | 36 | 40.9% |
 | Hillary Clinton | New York | Democratic |
395,185 |
47.90% | 36 | 40.9% |
 | John Edwards | North Carolina | Democratic |
16,763 |
2.03% | 0 | 0.0% |
| Uncommitted | - | Democratic |
3,142 |
0.38% | 0 | 0.0% |
| Other (+) | - | Democratic |
3,043 |
0.37% | 0 | 0% |
 | Unallocated | - | Democratic |
- |
- | 16 | 18.2% |
 |
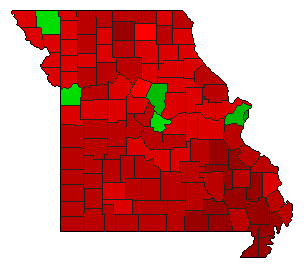
Map Key
| Turnout
 |  |  |
|
|
| | Election Information: | | Contest Type: | State-run Primary | | Election Date: | 2008-02-05 | | Eligible Participants: | Open (all voters) | | Delegates Awarded in this Contest: | 72 | | Delegates Total: | 88 | | Delegate Allocation Method: Proportional - the candidates are awarded delegates in proportion to the percentage of votes received. A 15% threshold is required to receive delegates. |
- 25 at-large delegates
- 47 district delegates
- 16 unpledged delegates
- 4 delegates from CDs 7, 8
- 5 delegates from CDs 2, 4, 6, 9
- 6 delegates from CDs 3, 5
- 7 delegates from CD 1
|
|
| Demographic Data
| 2010 Population: | 5,988,927 | Enum. | 2010 Population Density: | 33.6 | persons/km2 | | 2008 Population: | 5,923,916 | Est. | 2008 Population Density: | 33.2 | persons/km2 | | 2000 Population: | 5,595,211 | Enum. | 2000 Population Density: | 31.4 | persons/km2 | | Total Delegates: | 88.0 | | Delegates Density: | 67,317 | persons/Del | | Land Area (2000): | 178,414 | km2 | Annual Pop Growth Rate: | 0.7 | % |
| Election Data and Statistics:
| Election Tools
|
| |


