| |
Presidential
Candidate | Home State | Political
Party | Primary Vote | Delegates |
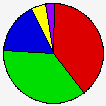
 | Hillary Clinton | New York | Democratic |
112,404 |
39.09% | 9 | 30.0% |
 | Barack Obama | Illinois | Democratic |
104,815 |
36.45% | 9 | 30.0% |
 | John Edwards | North Carolina | Democratic |
48,699 |
16.94% | 4 | 13.3% |
 | Bill Richardson | New Mexico | Democratic |
13,268 |
4.61% | 0 | 0.0% |
 | Dennis J. Kucinich | Ohio | Democratic |
3,891 |
1.35% | 0 | 0.0% |
| Other Candidates | - | Democratic |
2,962 |
1.03% | 0 | 0.0% |
| Other (+) | - | Democratic |
1,517 |
0.53% | 0 | 0% |
 | Unallocated | - | Democratic |
- |
- | 8 | 26.7% |
 |
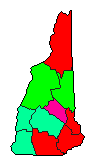
Map Key
| Turnout
 |  |  |
|
|
| | Election Information: | | Contest Type: | State-run Primary | | Election Date: | 2008-01-08 | | Eligible Participants: | Modified Open (members of the party or independents) | | Delegates Awarded in this Contest: | 22 | | Delegates Total: | 30 | | Delegate Allocation Method: Proportional - the candidates are awarded delegates in proportion to the percentage of votes received. A 15% threshold is required to receive delegates. |
- 8 at-large delegates
- 14 district delegates
- 8 unpledged delegates
- Congressional District 1: 7 delegates
- Congressional District 2: 7 delegates
|
|
| Demographic Data
| 2010 Population: | 1,316,470 | Enum. | 2010 Population Density: | 56.7 | persons/km2 | | 2008 Population: | 1,315,906 | Est. | 2008 Population Density: | 56.7 | persons/km2 | | 2000 Population: | 1,235,786 | Enum. | 2000 Population Density: | 53.2 | persons/km2 | | Total Delegates: | 30.0 | | Delegates Density: | 43,864 | persons/Del | | Land Area (2000): | 23,227 | km2 | Annual Pop Growth Rate: | 0.6 | % |
| Election Data and Statistics:
| Election Tools
|
| |


