| |
Presidential
Candidate | Home State | Political
Party | Primary Vote | Delegates |
 | Hillary Clinton | New York | Democratic |
336,245 |
53.82% | 39 | 45.9% |
 | Barack Obama | Illinois | Democratic |
252,874 |
40.48% | 29 | 34.1% |
 | John Edwards | North Carolina | Democratic |
27,820 |
4.45% | 0 | 0.0% |
 | Uncommitted | - | Democratic |
3,158 |
0.51% | 0 | 0.0% |
| Other (+) | - | Democratic |
4,667 |
0.75% | 0 | 0% |
 | Unallocated | - | Democratic |
- |
- | 17 | 20.0% |
 |
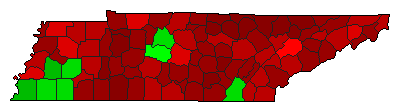
Map Key
| > 40% |
 |
 |  |
| > 50% |
 |
|  |
| > 60% |
 |
|  |
| > 70% |
 |
| |
| > 80% |
 |
| |
| Turnout
 |  |  |
|
|
| | Election Information: | | Contest Type: | State-run Primary | | Election Date: | 2008-02-05 | | Eligible Participants: | Open (all voters) | | Delegates Awarded in this Contest: | 68 | | Delegates Total: | 85 | | Delegate Allocation Method: Proportional - the candidates are awarded delegates in proportion to the percentage of votes received. A 15% threshold is required to receive delegates. |
- 24 at-large delegates
- 44 district delegates
- 17 unpledged delegates
- 4 delegates from CDs 1, 2, 3
- 5 delegates from CDs 4, 6, 7, 8
- 6 delegates from CDs 5, 9
|
|
| Demographic Data
| 2010 Population: | 6,346,105 | Enum. | 2010 Population Density: | 59.4 | persons/km2 | | 2008 Population: | 6,247,411 | Est. | 2008 Population Density: | 58.5 | persons/km2 | | 2000 Population: | 5,689,283 | Enum. | 2000 Population Density: | 53.3 | persons/km2 | | Total Delegates: | 85.0 | | Delegates Density: | 73,499 | persons/Del | | Land Area (2000): | 106,752 | km2 | Annual Pop Growth Rate: | 1.1 | % |
| Election Data and Statistics:
| Election Tools
|
| |


