| |
Presidential
Candidate | Home State | Political
Party | Primary Vote | Delegates |
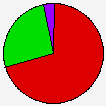
 | Hillary Clinton | New York | Democratic |
220,136 |
70.05% | 27 | 57.4% |
 | Barack Obama | Illinois | Democratic |
82,476 |
26.25% | 8 | 17.0% |
 | John Edwards | North Carolina | Democratic |
5,873 |
1.87% | 0 | 0.0% |
| Uncommitted | - | Democratic |
3,398 |
1.08% | 0 | 0.0% |
| Bill Richardson | New Mexico | Democratic |
810 |
0.26% | 0 | 0.0% |
| Other (+) | - | Democratic |
1,541 |
0.49% | 0 | 0% |
 | Unallocated | - | Democratic |
- |
- | 12 | 25.5% |
 |
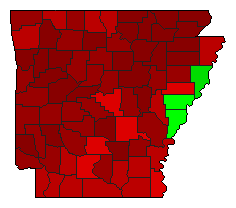
Map Key
| > 40% |
 |
|  |
| > 50% |
 |
|  |
| > 60% |
 |
| |
| > 70% |
 |
| |
| > 80% |
 |
| |
| Turnout
 |  |  |
|
|
| | Election Information: | | Contest Type: | State-run Primary | | Election Date: | 2008-02-05 | | Eligible Participants: | Open (all voters) | | Delegates Awarded in this Contest: | 35 | | Delegates Total: | 47 | | Delegate Allocation Method: Proportional - the candidates are awarded delegates in proportion to the percentage of votes received. A 15% threshold is required to receive delegates. |
- 13 at-large delegates
- 22 district delegates
- 12 unpledged delegates
- Congressional District 1: 6 delegates
- Congressional District 2: 6 delegates
- Congressional District 3: 5 delegates
- Congressional District 4: 5 delegates
|
|
| Demographic Data
| 2010 Population: | 2,915,918 | Enum. | 2010 Population Density: | 21.6 | persons/km2 | | 2008 Population: | 2,874,554 | Est. | 2008 Population Density: | 21.3 | persons/km2 | | 2000 Population: | 2,673,400 | Enum. | 2000 Population Density: | 19.8 | persons/km2 | | Total Delegates: | 47.0 | | Delegates Density: | 61,161 | persons/Del | | Land Area (2000): | 134,856 | km2 | Annual Pop Growth Rate: | 0.9 | % |
| Election Data and Statistics:
| Election Tools
|
| |


