| |
Presidential
Candidate | Home State | Political
Party | Primary Vote | Delegates |
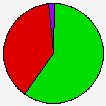
 | Barack Obama | Illinois | Democratic |
91,901 |
59.31% | 9 | 39.1% |
 | Hillary Clinton | New York | Democratic |
59,806 |
38.59% | 6 | 26.1% |
 | John Edwards | North Carolina | Democratic |
1,936 |
1.25% | 0 | 0.0% |
| Dennis J. Kucinich | Ohio | Democratic |
1,010 |
0.65% | 0 | 0.0% |
| Write-ins | - | Democratic |
307 |
0.20% | 0 | 0.0% |
 | Unallocated | - | Democratic |
- |
- | 8 | 34.8% |
 |
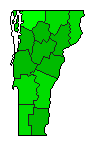
Map Key
| Turnout
 |  |  |
|
|
| | Election Information: | | Contest Type: | State-run Primary | | Election Date: | 2008-03-04 | | Eligible Participants: | Open (all voters) | | Delegates Awarded in this Contest: | 15 | | Delegates Total: | 23 | | Delegate Allocation Method: Proportional - the candidates are awarded delegates in proportion to the percentage of votes received. A 15% threshold is required to receive delegates. |
- 5 at-large delegates
- 10 district delegates
- 8 unpledged delegates
- All 10 are from the Vermont At-Large congressional district
|
|
| Demographic Data
| 2010 Population: | 625,741 | Enum. | 2010 Population Density: | 26.1 | persons/km2 | | 2008 Population: | 624,151 | Est. | 2008 Population Density: | 26.1 | persons/km2 | | 2000 Population: | 608,827 | Enum. | 2000 Population Density: | 25.4 | persons/km2 | | Total Delegates: | 23.0 | | Delegates Density: | 27,137 | persons/Del | | Land Area (2000): | 23,956 | km2 | Annual Pop Growth Rate: | 0.3 | % |
| Election Data and Statistics:
| Election Tools
|
| |


