| |
Presidential
Candidate | Home State | Political
Party | Caucus Result | Delegates |
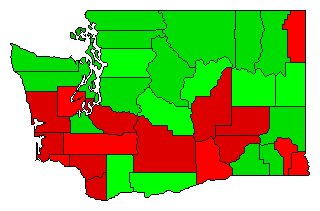
 | Barack Obama | Illinois | Democratic |
21,768 |
67.56% | 52 | 53.6% |
 | Hillary Clinton | New York | Democratic |
10,038 |
31.15% | 26 | 26.8% |
 | Uncommitted | - | Democratic |
364 |
1.13% | 0 | 0.0% |
| Other Candidates | - | Democratic |
50 |
0.16% | 0 | 0.0% |
 | Unallocated | - | Democratic |
- |
- | 19 | 19.6% |
 |
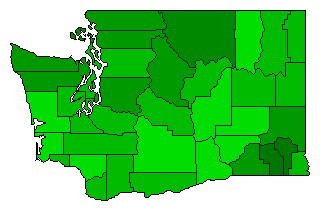
Map Key
| > 50% |
 |
|  |
| > 60% |
|
|  |
| > 70% |
|
|  |
| > 80% |
|
|  |
| > 90% |
|
|  |
| Turnout
 |  |  |
|
|
| | Election Information: | | Contest Type: | Party-run Caucus/Convention | | Caucus Date: | 2008-02-09 | | Eligible Participants: | Modified Open (members of the party or independents) | | Delegates Awarded in this Contest: | 78 | | Delegates Total: | 97 | | Delegate Allocation Method: Proportional - the candidates are awarded delegates in proportion to the percentage of votes received. A 15% threshold is required to receive delegates. |
- No actual convention delegates are awarded at the caucuses, rather each precinct caucus chooses delegates to attend the County Conventions.
- 51 district delegates are chosen at the Congressional District Caucuses on May 17
- 27 at-large delegates are chosen at the State Convention on June 15
- 19 unpledged delegates
- 3 delegates from CD 4
- 5 delegates from CDs 3, 5, 9
- 6 delegates from CDs 1, 2, 6, 8
- 9 delegates from CD 7
|
|
| Demographic Data
| 2010 Population: | 6,724,540 | Enum. | 2010 Population Density: | 39.0 | persons/km2 | | 2008 Population: | 6,562,231 | Est. | 2008 Population Density: | 38.1 | persons/km2 | | 2000 Population: | 5,894,121 | Enum. | 2000 Population Density: | 34.2 | persons/km2 | | Total Delegates: | 97.0 | | Delegates Density: | 67,652 | persons/Del | | Land Area (2000): | 172,348 | km2 | Annual Pop Growth Rate: | 1.3 | % |
| Election Data and Statistics:
| Election Tools
|
| |


