| |
Presidential
Candidate | Home State | Political
Party | Primary Vote | Delegates |
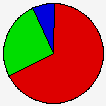
 | Hillary Clinton | New York | Democratic |
239,062 |
67.00% | 20 | 51.3% |
 | Barack Obama | Illinois | Democratic |
91,652 |
25.69% | 8 | 20.5% |
 | John Edwards | North Carolina | Democratic |
26,076 |
7.31% | 0 | 0.0% |
 | Unallocated | - | Democratic |
- |
- | 11 | 28.2% |
 |
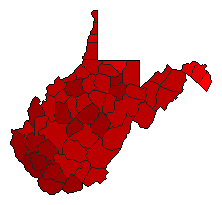
Map Key
| > 40% |
 |
 |
| > 50% |
 |
|
| > 60% |
 |
|
| > 70% |
 |
|
| > 80% |
 |
|
| Turnout
 |  |  |
|
|
| | Election Information: | | Contest Type: | State-run Primary | | Election Date: | 2008-05-13 | | Eligible Participants: | Modified Open (members of the party or independents) | | Delegates Awarded in this Contest: | 28 | | Delegates Total: | 39 | | Delegate Allocation Method: Proportional - the candidates are awarded delegates in proportion to the percentage of votes received. A 15% threshold is required to receive delegates. |
- 10 at-large delegates
- 18 district delegates
- 11 unpledged delegates
- Congressional District 1: 6 delegates
- Congressional District 2: 6 delegates
- Congressional District 3: 6 delegates
|
|
| Demographic Data
| 2010 Population: | 1,852,994 | Enum. | 2010 Population Density: | 29.7 | persons/km2 | | 2008 Population: | 1,840,310 | Est. | 2008 Population Density: | 29.5 | persons/km2 | | 2000 Population: | 1,808,344 | Enum. | 2000 Population Density: | 29.0 | persons/km2 | | Total Delegates: | 39.0 | | Delegates Density: | 47,187 | persons/Del | | Land Area (2000): | 62,361 | km2 | Annual Pop Growth Rate: | 0.2 | % |
| Election Data and Statistics:
| Election Tools
|
| |


