| |
Presidential
Candidate | Home State | Political
Party | Caucus Result | Delegates |
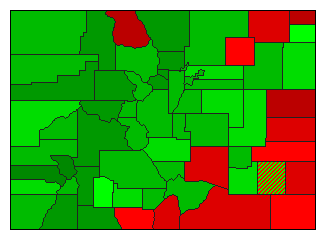
 | Barack Obama | Illinois | Democratic |
80,113 |
66.53% | 0 | 0.0% |
 | Hillary Clinton | New York | Democratic |
38,839 |
32.26% | 0 | 0.0% |
 | Uncommitted | - | Democratic |
1,260 |
1.05% | 0 | 0.0% |
| Other (+) | - | Democratic |
199 |
0.17% | 0 | 0% |
 |
Map Key
| > 40% |
 |
 |  |
| > 50% |
 |
|  |
| > 60% |
 |
|  |
| > 70% |
|
|  |
| > 80% |
|
|  |
| Turnout
 |  |  |
|
|
| | Election Information: | | Contest Type: | Party-run Caucus/Convention | | Caucus Date: | 2008-02-05 | | Eligible Participants: | Closed (only members of the party) | | Delegates Awarded in this Contest: | 0 | | Delegates Total: | 70 | | Delegate Allocation Method: Proportional - the candidates are awarded delegates in proportion to the percentage of votes received. A 15% threshold is required to receive delegates. |
|
| Demographic Data
| 2010 Population: | 5,029,196 | Enum. | 2010 Population Density: | 18.7 | persons/km2 | | 2008 Population: | 4,889,730 | Est. | 2008 Population Density: | 18.2 | persons/km2 | | 2000 Population: | 4,301,261 | Enum. | 2000 Population Density: | 16.0 | persons/km2 | | Total Delegates: | 0.0 | | Delegates Density: | | persons/Del | | Land Area (2000): | 268,627 | km2 | Annual Pop Growth Rate: | 1.6 | % |
| Election Data and Statistics:
| Election Tools
|
| |


