| |
Presidential
Candidate | Home State | Political
Party | Primary Vote | Delegates |
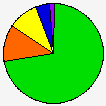
 | Mitt Romney | Massachusetts | Republican |
266,313 |
72.05% | 38 | 92.7% |
 | Rick Santorum | Virginia | Republican |
44,564 |
12.06% | 0 | 0.0% |
 | Ron Paul | Texas | Republican |
35,219 |
9.53% | 0 | 0.0% |
 | Newt Gingrich | Virginia | Republican |
16,991 |
4.60% | 0 | 0.0% |
 | Jon Huntsman, Jr. | Utah | Republican |
2,268 |
0.61% | 0 | 0.0% |
| Uncommitted | - | Republican |
1,793 |
0.49% | 0 | 0.0% |
| Rick Perry | Texas | Republican |
991 |
0.27% | 0 | 0.0% |
| Other (+) | - | Republican |
1,478 |
0.40% | 0 | 0% |
 | Unallocated | - | Republican |
- |
- | 3 | 7.3% |
 |
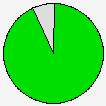
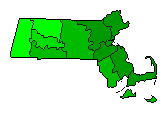
Map Key
| Turnout
 |  |  |
|
|
| | Election Information: | | Contest Type: | State-run Primary | | Election Date: | 2012-03-06 | | Eligible Participants: | Modified Open (members of the party or independents) | | Delegates Awarded in this Contest: | 38 | | Delegates Total: | 41 | Statewide Delegates: Proportional - a 15% threshold is required to receive delegates.
Congressional District Delegates: Proportional - a 15% threshold is required to receive delegates. |
|
| Demographic Data
| 2012 Population: | 6,664,269 | Est. | 2012 Population Density: | 328.2 | persons/km2 | | 2010 Population: | 6,547,629 | Enum. | 2010 Population Density: | 322.4 | persons/km2 | | Total Delegates: | 41 | | Delegates Density: | 162,543 | persons/Del | | Land Area (2000): | 20,306 | km2 | Annual Pop Growth Rate: | 0.9 | % |
| Election Data and Statistics:
| Election Tools
|
| |


