Home
2024
Election Results
Election Info
Weblog
Forum
Wiki
Search
Email
Login
Site Info
Store
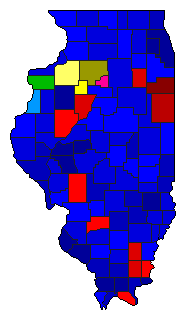
1936 Gubernatorial Republican Primary Election Results - Illinois
Note: The Google advertisement links below may advocate political positions that this site does not endorse.
Data for this Contest was Contributed by on 2010-10-11
Gubernatorial
Candidate
Political
Party
Popular Vote
C. Wayland Brooks
Republican
596,445
59.05%
Lennington H. Small
Republican
268,903
26.62%
Oscar E. Carlstrom
Republican
53,266
5.27%
Thomas P. Gunning
Republican
31,194
3.09%
J. Paul Kuhn
Republican
29,423
2.91%
H. Wallace Caldwell
Republican
16,079
1.59%
John G. Oglesby
Republican
7,568
0.75%
George W. Dowell
Republican
7,125
0.71%
Write-ins
-
1
0.00%
Map Key
> 30%
> 40%
> 50%
> 60%
> 70%
> 80%
Turnout
Maps
Demographic Data
1940 Population:
7,897,241
Enum.
1940 Population Density:
54.9
persons/km
2
1930 Population:
7,630,654
Enum.
1930 Population Density:
53.0
persons/km
2
Land Area (2000):
143,961
km
2
Annual Pop Growth Rate:
0.3
%
Election Data and Statistics:
County Data (Table)
(m)
County Data (Graphs)
(m)
Compare State Maps by Year
View All 1936 Illinois Maps
Election Tools
Atlas Forum
Image Code for Maps:
County
Data Sources:
Source for Popular Vote data: Illinois Secretary of State, Comp, "Primary Vote for Governor-All Parties-April 14, 1936,"
Illinois Blue Book, 1935-1936
(Springfield: Illinois Secretary of State, 1936)
Source for Population data: U.S. Census Bureau.
Results for and Individual County:
(m)
Choose Year
2022
2018
2014
2010
2006
2002
1998
1994
1990
1982
1976
1972
1944
1940
1932
1928
1924
1920
1916
1908
Choose Office
Choose State
Vermont
Washington
Illinois Election Results Home
-
National Results for 1936
-
Use Frame Navigation
Login
Terms of Use
-
DCMA Policy
-
Privacy Policy and Cookies
©
Dave Leip's Atlas of U.S. Elections, LLC 2019 All Rights Reserved


