Home
2024
Election Results
Election Info
Weblog
Forum
Wiki
Search
Email
Login
Site Info
Store
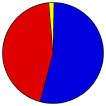
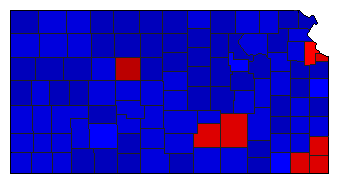
1960 Lt. Gubernatorial General Election Results - Kansas
Note: The Google advertisement links below may advocate political positions that this site does not endorse.
Data for this Contest was Contributed by on 2023-05-20
Lt. Gubernatorial
Candidate
Political
Party
Popular Vote
Harold H. Chase
Republican
465,295
53.73%
Jack Glaves
Democratic
386,208
44.60%
Sam Walker
Prohibition
14,440
1.67%
Map Key
> 40%
> 50%
> 60%
> 70%
Turnout
Maps
Pop. (m)
Election Notes:
The Kansas Secretary of State's Election Results lists Jack Glaves' vote total as 386,235
Demographic Data
1960 Population:
2,178,611
Enum.
1960 Population Density:
10.3
persons/km
2
1950 Population:
1,905,299
Enum.
1950 Population Density:
9.0
persons/km
2
Land Area (2000):
211,900
km
2
Annual Pop Growth Rate:
1.3
%
Election Data and Statistics:
County Data (Table)
(m)
County Data (Graphs)
Compare State Data by Year (Table)
Compare State Data by Year (Graphs)
View All 1960 Kansas Data
Compare State Maps by Year
View All 1960 Kansas Maps
Election Tools
Atlas Forum
Image Code for Maps:
County
,
Pop
Data Sources:
Source for Popular Vote data: Kansas Secretary of State.
Election Statistics
, Kansas Secretary of State (https://cdm16884.contentdm.oclc.org/digital/collection/p16884coll129/id/57/rec/5) (accessed 20 May 2023)
Source for Population data: U.S. Census Bureau.
Results for and Individual County:
(m)
Choose Year
1972
1970
1968
1966
1964
1962
1958
1956
1954
1952
1950
1914
1912
1910
Choose Office
President
Senator
Governor
Secretary of State
State Treasurer
Attorney General
State Auditor
Insurance Commissioner
Choose State
Delaware
Illinois
Massachusetts
Michigan
Minnesota
Nebraska
North Dakota
Rhode Island
South Dakota
Washington
Kansas Election Results Home
-
National Results for 1960
-
Use Frame Navigation
Login
Terms of Use
-
DCMA Policy
-
Privacy Policy and Cookies
©
Dave Leip's Atlas of U.S. Elections, LLC 2019 All Rights Reserved


