Home
2024
Election Results
Election Info
Weblog
Forum
Wiki
Search
Email
Login
Site Info
Store
1975 Gubernatorial General Election Results - Louisiana
Note: The Google advertisement links below may advocate political positions that this site does not endorse.
Data for this Contest was Contributed by on 2024-01-18
Gubernatorial
Candidate
Political
Party
Popular Vote
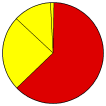
Edwin Edwards
Democratic
750,107
62.35%
Bob Jones
Democratic
292,220
24.29%
Wade O. Martin Jr.
Democratic
146,368
12.17%
Ken Lewis
Democratic
5,307
0.44%
Addison Roswell Thompson
Democratic
4,664
0.39%
Cecilia M. Pizzo
Democratic
4,338
0.36%
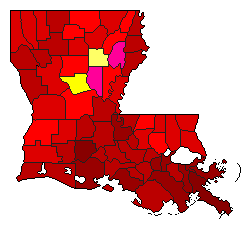
Map Key
> 30%
> 40%
> 50%
> 60%
> 70%
> 80%
Turnout
Maps
Pop. (m)
Demographic Data
1980 Population:
4,206,116
Enum.
1980 Population Density:
37.3
persons/km
2
1975 Population:
0
Est.
1975 Population Density:
0.0
persons/km
2
1970 Population:
3,644,637
Enum.
1970 Population Density:
32.3
persons/km
2
Land Area (2000):
112,825
km
2
Annual Pop Growth Rate:
1.4
%
Election Data and Statistics:
Parish Data (Table)
(m)
Parish Data (Graphs)
Compare State Data by Year (Table)
Compare State Data by Year (Graphs)
View All 1975 Louisiana Data
Compare State Maps by Year
View All 1975 Louisiana Maps
Election Tools
Atlas Forum
Image Code for Maps:
County
,
Pop
Data Sources:
Source for Popular Vote data: Secretary of State of Louisiana,
Primary and General Election Returns
(Baton Rouge: Secretary of State of Louisiana, 1975)
Source for Population data: U.S. Census Bureau.
Results for and Individual Parish:
(m)
Choose Year
2023
2019
2015
2011
2007
2003
1999
1995
1991
1983
1972
1928
Choose Office
Choose State
Kentucky
1991 >
Louisiana Election Results Home
-
National Results for 1975
-
Use Frame Navigation
Login
Terms of Use
-
DCMA Policy
-
Privacy Policy and Cookies
©
Dave Leip's Atlas of U.S. Elections, LLC 2019 All Rights Reserved


