Home
2024
Election Results
Election Info
Weblog
Forum
Wiki
Search
Email
Login
Site Info
Store
1967 Gubernatorial General Election Results - Mississippi
Note: The Google advertisement links below may advocate political positions that this site does not endorse.
Data for this Contest was Contributed by on 2022-03-06
Gubernatorial
Candidate
Political
Party
Popular Vote
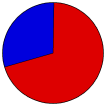
John Bell Williams
Democratic
315,318
70.27%
Rubel L. Phillips
Republican
133,379
29.73%
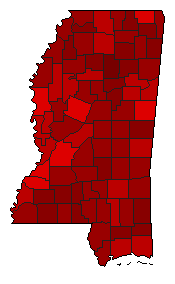
Map Key
> 50%
> 60%
> 70%
> 80%
> 90%
Turnout
Maps
Demographic Data
1970 Population:
2,216,994
Enum.
1970 Population Density:
18.2
persons/km
2
1960 Population:
2,178,141
Enum.
1960 Population Density:
17.9
persons/km
2
Land Area (2000):
121,488
km
2
Annual Pop Growth Rate:
0.2
%
Election Data and Statistics:
County Data (Table)
(m)
County Data (Graphs)
Compare State Data by Year (Table)
Compare State Data by Year (Graphs)
View All 1967 Mississippi Data
Compare State Maps by Year
View All 1967 Mississippi Maps
Election Tools
Atlas Forum
Image Code for Maps:
County
Data Sources:
Source for Popular Vote data: Mississippi Secretary of State.
Mississippi Official and Statistical Register 1968-1972
, Mississippi Secretary of State (https://babel.hathitrust.org/cgi/pt?id=uiug.30112086088652&view=1up&seq=462) (accessed 6 Mar 2022)
Source for Population data: U.S. Census Bureau.
Results for and Individual County:
(m)
Choose Year
2023
2019
2015
2011
2007
2003
1999
1995
1991
1987
1983
1979
1971
1963
Choose Office
Choose State
Kentucky
1991 >
Mississippi Election Results Home
-
National Results for 1967
-
Use Frame Navigation
Login
Terms of Use
-
DCMA Policy
-
Privacy Policy and Cookies
©
Dave Leip's Atlas of U.S. Elections, LLC 2019 All Rights Reserved


