Home
2024
Election Results
Election Info
Weblog
Forum
Wiki
Search
Email
Login
Site Info
Store
1954 Attorney General General Election Results - Nevada
Note: The Google advertisement links below may advocate political positions that this site does not endorse.
Data for this Contest was Contributed by on 2023-12-28
Attorney General
Candidate
Political
Party
Popular Vote
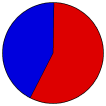
Harvey Dickerson
Democratic
42,872
57.12%
Dale Murphy
Republican
32,181
42.88%
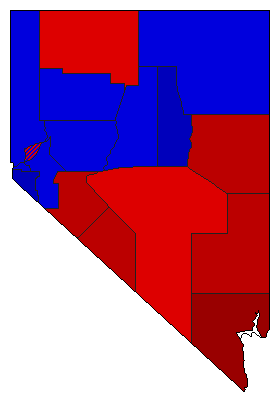
Map Key
> 40%
> 50%
> 60%
> 70%
Turnout
Maps
Demographic Data
1960 Population:
285,278
Enum.
1960 Population Density:
1.0
persons/km
2
1950 Population:
160,083
Enum.
1950 Population Density:
0.6
persons/km
2
Land Area (2000):
284,448
km
2
Annual Pop Growth Rate:
5.9
%
Election Data and Statistics:
County Data (Table)
(m)
County Data (Graphs)
(m)
Compare State Data by Year (Table)
Compare State Data by Year (Graphs)
View All 1954 Nevada Data
Compare State Maps by Year
View All 1954 Nevada Maps
Election Tools
Atlas Forum
Image Code for Maps:
County
Data Sources:
Source for Popular Vote data: Nevada Secretary of State.
Official Returns of the General Election 1954
, Nevada Secretary of State (https://babel.hathitrust.org/cgi/pt?id=mdp.39015067324445&view=1up&seq=78) (accessed 28 Dec 2023)
Source for Population data: U.S. Census Bureau.
Results for and Individual County:
(m)
Choose Year
2022
2018
2014
2010
2006
2002
1998
1994
1990
1986
1982
1978
1974
1970
1966
1962
1958
1950
1946
1942
1938
1934
1930
1926
1922
1918
1914
1910
1906
1902
1898
1894
1890
1886
1882
1878
1874
1870
1866
1864
Choose Office
Governor
Lt. Governor
Secretary of State
State Treasurer
Controller
Choose State
Arizona
California
Colorado
Delaware
Kansas
Maryland
Massachusetts
Michigan
Minnesota
New Mexico
North Dakota
Oklahoma
Rhode Island
South Dakota
Wisconsin
2022 >
Nevada Election Results Home
-
National Results for 1954
-
Use Frame Navigation
Login
Terms of Use
-
DCMA Policy
-
Privacy Policy and Cookies
©
Dave Leip's Atlas of U.S. Elections, LLC 2019 All Rights Reserved


