Home
2024
Election Results
Election Info
Weblog
Forum
Wiki
Search
Email
Login
Site Info
Store
1926 Attorney General General Election Results - Arizona
Note: The Google advertisement links below may advocate political positions that this site does not endorse.
Data for this Contest was Contributed by on 2023-11-20
Attorney General
Candidate
Political
Party
Popular Vote
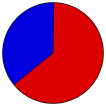
John W. Murphy
Democratic
43,567
63.62%
Alfred H. Gale
Republican
24,911
36.38%
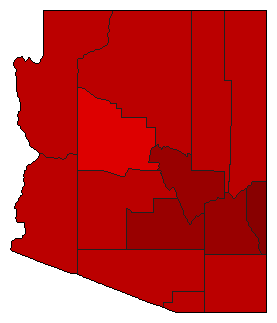
Map Key
> 50%
> 60%
> 70%
> 80%
Turnout
Maps
Demographic Data
1930 Population:
435,573
Enum.
1930 Population Density:
1.5
persons/km
2
1920 Population:
334,162
Enum.
1920 Population Density:
1.1
persons/km
2
Land Area (2000):
294,312
km
2
Annual Pop Growth Rate:
2.7
%
Election Data and Statistics:
County Data (Table)
(m)
County Data (Graphs)
(m)
Compare State Data by Year (Table)
Compare State Data by Year (Graphs)
View All 1926 Arizona Data
Compare State Maps by Year
View All 1926 Arizona Maps
Election Tools
Atlas Forum
Image Code for Maps:
County
Data Sources:
Source for Popular Vote data: Arizona Secretary of State.
Official Canvass General Election Returns, State of Arizona, November 2, 1926
, Arizona Secretary of State (https://azmemory.azlibrary.gov/nodes/view/282066) (accessed 20 Nov 2023)
Source for Population data: U.S. Census Bureau.
Results for and Individual County:
(m)
Choose Year
2022
2018
2014
2010
2006
2002
1998
1994
1990
1986
1982
1978
1974
1970
1968
1966
1964
1962
1960
1958
1956
1954
1952
1950
1948
1946
1944
1942
1940
1938
1936
1934
1932
1930
1928
1924
1922
1920
1918
1916
1914
1911
Choose Office
Senator
Governor
Secretary of State
State Treasurer
State Auditor
Choose State
California
Colorado
Maryland
Nevada
2022 >
Arizona Election Results Home
-
National Results for 1926
-
Use Frame Navigation
Login
Terms of Use
-
DCMA Policy
-
Privacy Policy and Cookies
©
Dave Leip's Atlas of U.S. Elections, LLC 2019 All Rights Reserved


