Home
2024
Election Results
Election Info
Weblog
Forum
Wiki
Search
Email
Login
Site Info
Store
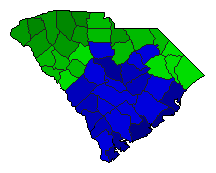
1940 Referendum General Election Results - South Carolina
Note: The Google advertisement links below may advocate political positions that this site does not endorse.
Data for this Contest was Contributed by on 2024-02-10
Referendum: Liquor Referendum
Popular Vote
Yes (Dry)
189,361
59.23%
No (Wet)
130,366
40.77%
Map Key
> 50%
> 60%
> 70%
> 80%
Turnout
Maps
Pop. (m)
Election Notes:
"Are you in favor of discontinuing the legal of sale intoxicating liquors, wines, beers, or other intoxicating beverages, and the imposition of new taxes to replace the lost revenues as a result of repeal of present liquor laws?"
Demographic Data
1940 Population:
1,899,804
Enum.
1940 Population Density:
24.4
persons/km
2
1930 Population:
1,738,765
Enum.
1930 Population Density:
22.3
persons/km
2
Land Area (2000):
77,983
km
2
Annual Pop Growth Rate:
0.9
%
Election Data and Statistics:
County Data (Table)
(m)
County Data (Graphs)
(m)
Compare State Data by Year (Table)
Compare State Data by Year (Graphs)
View All 1940 South Carolina Data
Compare State Maps by Year
View All 1940 South Carolina Maps
Election Tools
Atlas Forum
Image Code for Maps:
County
,
Pop
Data Sources:
Source for Popular Vote data: University of Alabam.
Southern Primaries and Elections, 1920-1949
, University of Alabam (http://) (accessed 09 Feb 2024)
Source for Population data: U.S. Census Bureau.
Results for and Individual County:
(m)
Choose Year
2006
1998
Choose Office
President
Choose State
South Carolina Election Results Home
-
National Results for 1940
-
Use Frame Navigation
Login
Terms of Use
-
DCMA Policy
-
Privacy Policy and Cookies
©
Dave Leip's Atlas of U.S. Elections, LLC 2019 All Rights Reserved


