Home
2024
Election Results
Election Info
Weblog
Forum
Wiki
Search
Email
Login
Site Info
Store
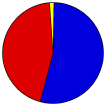
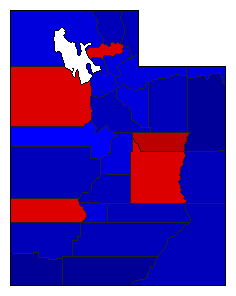
1976 Senatorial General Election Results - Utah
Note: The Google advertisement links below may advocate political positions that this site does not endorse.
Data for this Contest was Contributed by on 2024-02-19
Senatorial
Candidate
Political
Party
Popular Vote
Orrin G. Hatch
Republican
290,221
53.73%
Frank E. Moss
Democratic
241,948
44.80%
George M. Batchelor
American Independent
4,913
0.91%
Steve Trotter
Libetarian
3,026
0.56%
Map Key
> 40%
> 50%
> 60%
> 70%
Turnout
Maps
Pop. (m)
Demographic Data
1980 Population:
1,461,037
Enum.
1980 Population Density:
6.9
persons/km
2
1976 Population:
1,272,365
Est.
1976 Population Density:
6.0
persons/km
2
1970 Population:
1,059,273
Enum.
1970 Population Density:
5.0
persons/km
2
Land Area (2000):
212,751
km
2
Annual Pop Growth Rate:
3.3
%
Election Data and Statistics:
County Data (Table)
(m)
County Data (Graphs)
Compare State Data by Year (Table)
Compare State Data by Year (Graphs)
View All 1976 Utah Data
Compare State Maps by Year
View All 1976 Utah Maps
Election Tools
Atlas Forum
Image Code for Maps:
County
,
Pop
Data Sources:
Source for Popular Vote data: UT State Archives,
1976 General Election Abstract
(Salt Lake City, 1976)
Source for Population data: U.S. Census Bureau.
Results for and Individual County:
(m)
Choose Year
2022
2018
2016
2012
2010
2006
2004
2000
1998
1994
1992
1988
1986
1982
1980
1974
1970
1968
1964
1962
1956
1950
1940
1938
1932
1928
1920
Choose Office
President
Governor
Choose State
Arizona
California
Connecticut
Delaware
Florida
Hawaii
Indiana
Maine
Maryland
Massachusetts
Michigan
Minnesota
Missouri
Montana
Nebraska
Nevada
New Jersey
New Mexico
New York
North Dakota
Ohio
Pennsylvania
Rhode Island
Vermont
Virginia
Washington
West Virginia
Wisconsin
1992 >
Utah Election Results Home
-
National Results for 1976
-
Use Frame Navigation
Login
Terms of Use
-
DCMA Policy
-
Privacy Policy and Cookies
©
Dave Leip's Atlas of U.S. Elections, LLC 2019 All Rights Reserved


