Home
2024
Election Results
Election Info
Weblog
Forum
Wiki
Search
Email
Login
Site Info
Store
1853 Controller General Election Results - California
Note: The Google advertisement links below may advocate political positions that this site does not endorse.
Data for this Contest was Contributed by on 2024-01-10
Controller
Candidate
Political
Party
Popular Vote
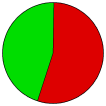
Samuel Bell
Democratic
42,083
54.49%
Gilbert E. Winters
Whig
35,145
45.51%
Map Key
> 50%
> 60%
> 70%
> 80%
> 90%
Turnout
Maps
Election Notes:
Candidates' party affiliations obtained from the 9/10/1853 Shasta Courier. https://www.cdnc.ucr.edu/?a=d&d=SCR18530910.2.17.2&e=-------en--20--1--txt-txIN--------
Election Data and Statistics:
County Data (Table)
(m)
County Data (Graphs)
(m)
Compare State Data by Year (Table)
Compare State Data by Year (Graphs)
View All 1853 California Data
Compare State Maps by Year
View All 1853 California Maps
Election Tools
Atlas Forum
Image Code for Maps:
County
Data Sources:
Source for Popular Vote data: California State Archives, "Comptroller,"
Statement of Returns of Election held September 7th 1853
(Benicia, 1853)
Results for and Individual County:
(m)
Choose Year
2022
2018
2014
2010
2006
2002
1998
1994
1990
1986
1982
1978
1974
1970
1966
1962
1958
1954
1950
1946
1942
1938
1934
1930
1926
1922
1918
1914
1910
1906
1902
1898
1894
1890
1886
1882
1879
1875
1871
1867
1863
1861
1859
1857
1855
1851
Choose Office
Governor
Lt. Governor
State Treasurer
Attorney General
Choose State
California Election Results Home
-
National Results for 1853
-
Use Frame Navigation
Login
Terms of Use
-
DCMA Policy
-
Privacy Policy and Cookies
©
Dave Leip's Atlas of U.S. Elections, LLC 2019 All Rights Reserved


