| |
Presidential
Candidate | Vice Presidential
Candidate | Political
Party | Popular Vote | Electoral Vote |
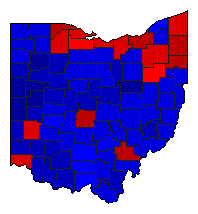
 | Barack H. Obama | Joseph R. Biden, Jr. | Democratic |
2,827,709 |
50.58% | 18 |
 | Willard Mitt Romney | Paul Ryan | Republican |
2,661,437 |
47.60% | 0 |
 | Gary Johnson | James P. Gray | Libertarian |
49,493 |
0.89% | 0 |
| Jill Stein | Cheri Honkala | Green |
18,573 |
0.33% | 0 |
| Other (+) | - | - |
33,722 |
0.60% | 0 |
 |
Map Key
| Turnout
 |  |  |
|
|
| Election Notes:
- Vote totals are corrected from from Official Totals based on amended results in Clark County (source: Clark County Board of Elections)
- Official Results do not count any write-in votes for candidates that did not register for qualified write-in status. Officially registered write-in votes as follows: Susan Daniels 1, Nelson Keyton 1, Mike Vargo 12. The write-ins votes listed here were collected from each county official report (incomplete data).
| Demographic Data
| 2012 Population: | 11,550,971 | Est. | 2012 Population Density: | 108.9 | persons/km2 | | 2010 Population: | 11,536,504 | Enum. | 2010 Population Density: | 108.8 | persons/km2 | | Total Electoral Vote: | 18 | | Electoral Vote Density: | 641,721 | persons/EV | | Land Area (2000): | 106,056 | km2 | Annual Pop Growth Rate: | 0.1 | % |
| Election Data and Statistics:
| Election Tools
- Atlas Forum Image Code for Maps: County, Pop, Tnd, Swg
Data Sources:
- Source for Popular Vote data: Ohio Secretary of State Election Services. Overview of Official Results for 2012 General Election, Ohio Secretary of State Election Services (http://www.sos.state.oh.us/sos/upload/elections/2012/gen/FinalResults.xlsx
) (accessed 25 Feb 2013)
- Source for Population data: U.S. Census Bureau.
| Results for and Individual County:
| | Primary Documentation:
|
| The 2012 Campaign:
|
|
| |


