| |
Presidential
Candidate | Vice Presidential
Candidate | Political
Party | Popular Vote | Electoral Vote |
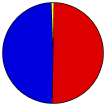
 | Barack H. Obama | Joseph R. Biden, Jr. | FL Democratic |
4,237,756 |
49.90% | 29 |
 | Willard Mitt Romney | Paul Ryan | Republican FL |
4,163,447 |
49.03% | 0 |
 | Gary Johnson | James P. Gray | Libertarian FL |
44,726 |
0.53% | 0 |
| Other (+) | - | - |
46,246 |
0.54% | 0 |
 |
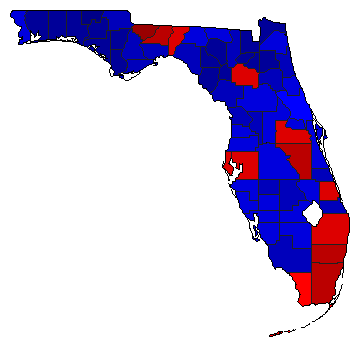
Map Key
| > 40% |
 |
 |
| > 50% |
 |
 |
| > 60% |
 |
 |
| > 70% |
 |
 |
| > 80% |
 |
 |
| Turnout
 |  |  |
|
|
| Election Notes:
- The Official Results do not count any write-in votes for candidates that did not register for qualified write-in status. The write-ins votes listed here were collected from each county election agency and the Florida 2012 Over/Under Report
| Demographic Data
| 2012 Population: | 19,302,016 | Est. | 2012 Population Density: | 138.2 | persons/km2 | | 2010 Population: | 18,801,310 | Enum. | 2010 Population Density: | 134.6 | persons/km2 | | Total Electoral Vote: | 29 | | Electoral Vote Density: | 665,587 | persons/EV | | Land Area (2000): | 139,670 | km2 | Annual Pop Growth Rate: | 1.3 | % |
| Election Data and Statistics:
| Election Tools
- Atlas Forum Image Code for Maps: County, Pop, Tnd, Swg
Data Sources:
- Source for Popular Vote data: Florida Department of State Division of Elections. 2012 General Election November 6, 2012 Official Results President of the United States, Florida Department of State Division of Elections (http://enight.elections.myflorida.com/FederalOffices/President/
) (accessed 20 Nov 2012)
- Source for Population data: U.S. Census Bureau.
| Results for and Individual County:
| | Primary Documentation:
|
| The 2012 Campaign:
|
|
| |


