| |
Presidential
Candidate | Vice Presidential
Candidate | Political
Party | Popular Vote | Electoral Vote |
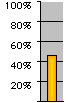
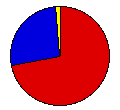
 | Barack H. Obama | Joseph R. Biden, Jr. | Democratic |
325,871 |
71.85% | 4 |
 | John S. McCain, III | Sarah Palin | Republican |
120,566 |
26.58% | 0 |
 | Ralph Nader | Matt Gonzalez | Independent |
3,825 |
0.84% | 0 |
| Bob Barr | Wayne A. Root | Libertarian |
1,314 |
0.29% | 0 |
| Other (+) | - | - |
1,992 |
0.44% | 0 |
 |
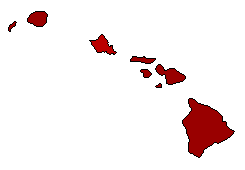
Map Key
| Turnout
 |  |  |
|
|
| Demographic Data
| 2010 Population: | 1,360,301 | Enum. | 2010 Population Density: | 81.9 | persons/km2 | | 2008 Population: | 1,332,213 | Est. | 2008 Population Density: | 80.3 | persons/km2 | | 2000 Population: | 1,211,684 | Enum. | 2000 Population Density: | 73.0 | persons/km2 | | Total Electoral Vote: | 4 | | Electoral Vote Density: | 333,053 | persons/EV | | Land Area (2000): | 16,600 | km2 | Annual Pop Growth Rate: | 1.2 | % |
| Election Data and Statistics:
| Election Tools
- Atlas Forum Image Code for Maps: County, CD, Pop, Prc, Tnd, Swg
Data Sources:
- Source for Popular Vote data: State of Hawaii Office of Elections. 2008 Hawaii General Election - Official Results, State of Hawaii Office of Elections (
) (accessed 15 Nov 2008)
- Source for Population data: U.S. Census Bureau.
| Results for and Individual County:
| | Primary Documentation:
|
| The 2008 Campaign:
|
|
| |


