Home
2024
Election Results
Election Info
Weblog
Forum
Wiki
Search
Email
Login
Site Info
Store
1968 Attorney General General Election Results - Kansas
Note: The Google advertisement links below may advocate political positions that this site does not endorse.
Data for this Contest was Contributed by on 2023-05-04
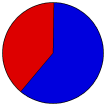
Attorney General
Candidate
Political
Party
Popular Vote
Kent Frizzell
Republican
476,173
60.72%
Jerry Muth
Democratic
308,097
39.28%
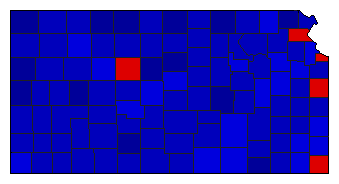
Map Key
> 40%
> 50%
> 60%
> 70%
Turnout
Maps
Demographic Data
1970 Population:
2,249,071
Enum.
1970 Population Density:
10.6
persons/km
2
1960 Population:
2,178,611
Enum.
1960 Population Density:
10.3
persons/km
2
Land Area (2000):
211,900
km
2
Annual Pop Growth Rate:
0.3
%
Election Data and Statistics:
County Data (Table)
(m)
County Data (Graphs)
Compare State Data by Year (Table)
Compare State Data by Year (Graphs)
View All 1968 Kansas Data
Compare State Maps by Year
View All 1968 Kansas Maps
Election Tools
Atlas Forum
Image Code for Maps:
County
Data Sources:
Source for Popular Vote data: Kansas Secretary of State.
Election Statistics
, Kansas Secretary of State (https://cdm16884.contentdm.oclc.org/digital/collection/p16884coll129/id/60/rec/5) (accessed 04 May 2023)
Source for Population data: U.S. Census Bureau.
Results for and Individual County:
(m)
Choose Year
2022
2018
2014
2010
2006
2002
1998
1994
1990
1986
1982
1978
1974
1972
1970
1966
1964
1962
1960
1958
1956
1954
1952
1950
1914
1912
1910
Choose Office
President
Senator
Governor
Lt. Governor
Secretary of State
State Treasurer
State Auditor
Insurance Commissioner
Choose State
Arizona
Illinois
Indiana
Missouri
New Mexico
North Carolina
North Dakota
Oregon
Rhode Island
South Dakota
Washington
Wisconsin
2022 >
Kansas Election Results Home
-
National Results for 1968
-
Use Frame Navigation
Login
Terms of Use
-
DCMA Policy
-
Privacy Policy and Cookies
©
Dave Leip's Atlas of U.S. Elections, LLC 2019 All Rights Reserved


