Home
2024
Election Results
Election Info
Weblog
Forum
Wiki
Search
Email
Login
Site Info
Store
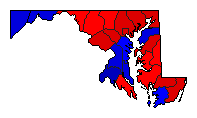
1899 Gubernatorial General Election Results - Maryland
Note: The Google advertisement links below may advocate political positions that this site does not endorse.
Data for this Contest was Contributed by on 2022-11-27
Gubernatorial
Candidate
Political
Party
Popular Vote
John Walter Smith
Democratic
128,409
51.12%
Lloyd Lowndes Jr.
Republican
116,286
46.29%
James Swann
Prohibition
5,275
2.10%
Other (
+
)
-
1,222
0.49%
Map Key
> 40%
> 50%
> 60%
> 70%
Turnout
Maps
Demographic Data
1900 Population:
1,188,044
Enum.
1900 Population Density:
46.9
persons/km
2
1890 Population:
0
Enum.
1890 Population Density:
0.0
persons/km
2
Land Area (2000):
25,314
km
2
Annual Pop Growth Rate:
0
%
Election Data and Statistics:
County Data (Table)
(m)
County Data (Graphs)
(m)
Compare State Data by Year (Table)
Compare State Data by Year (Graphs)
View All 1899 Maryland Data
Compare State Maps by Year
View All 1899 Maryland Maps
Election Tools
Atlas Forum
Image Code for Maps:
County
Data Sources:
Source for Popular Vote data: Maryland Secretary of State.
Maryland Manual, 1899
, Maryland Secretary of State (https://msa.maryland.gov/megafile/msa/speccol/sc2900/sc2908/000001/000111/html/am111--263.html) (accessed 27 Nov 2022)
Source for Population data: U.S. Census Bureau.
Results for and Individual County:
(m)
Choose Year
2022
2018
2014
2010
2006
2002
1998
1994
1990
1986
1982
1978
1974
1970
1966
1962
1958
1954
1950
1946
1942
1938
1934
1930
1926
1923
1919
1915
Choose Office
Choose State
Kentucky
Massachusetts
1990 >
Maryland Election Results Home
-
National Results for 1899
-
Use Frame Navigation
Login
Terms of Use
-
DCMA Policy
-
Privacy Policy and Cookies
©
Dave Leip's Atlas of U.S. Elections, LLC 2019 All Rights Reserved


