Home
2024
Election Results
Election Info
Weblog
Forum
Wiki
Search
Email
Login
Site Info
Store
1970 Lt. Gubernatorial General Election Results - Maryland
Note: The Google advertisement links below may advocate political positions that this site does not endorse.
Data for this Contest was Contributed by on 2016-05-03
Lt. Gubernatorial
Candidate
Political
Party
Popular Vote
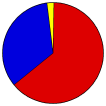
Blair Lee, III
Democratic
504,167
63.65%
Herbert John Miller, Jr.
Republican
268,381
33.88%
Elbert G. Miller
American
19,559
2.47%
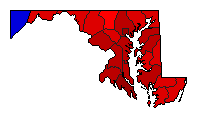
Map Key
> 40%
> 50%
> 60%
> 70%
Turnout
Maps
Demographic Data
1970 Population:
3,923,897
Enum.
1970 Population Density:
155.0
persons/km
2
1960 Population:
3,100,689
Enum.
1960 Population Density:
122.5
persons/km
2
Land Area (2000):
25,314
km
2
Annual Pop Growth Rate:
2.4
%
Election Data and Statistics:
County Data (Table)
(m)
County Data (Graphs)
Compare State Data by Year (Table)
Compare State Data by Year (Graphs)
View All 1970 Maryland Data
Compare State Maps by Year
View All 1970 Maryland Maps
Election Tools
Atlas Forum
Image Code for Maps:
County
Data Sources:
Source for Popular Vote data: Maryland Secretary of State.
Maryland Manual 1971-1972
, Maryland Secretary of State (http://msa.maryland.gov/megafile/msa/speccol/sc2900/sc2908/000001/000175/pdf/am175--516.pdf) (accessed 3 May 2016)
Source for Population data: U.S. Census Bureau.
Results for and Individual County:
(m)
Choose Year
Choose Office
President
Senator
Governor
Attorney General
Comptroller General
Choose State
Alabama
California
Kansas
Minnesota
Nebraska
Nevada
Ohio
Oklahoma
Rhode Island
South Carolina
South Dakota
Vermont
Maryland Election Results Home
-
National Results for 1970
-
Use Frame Navigation
Login
Terms of Use
-
DCMA Policy
-
Privacy Policy and Cookies
©
Dave Leip's Atlas of U.S. Elections, LLC 2019 All Rights Reserved


