| |
Presidential
Candidate | Home State | Political
Party | Primary Vote | Delegates |
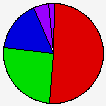
 | William J. Clinton | Arkansas | Democratic |
297,280 |
50.73% | 0 | 0.0% |
 | Edmund G. Brown | California | Democratic |
151,400 |
25.84% | 0 | 0.0% |
 | Paul E. Tsongas | Massachusetts | Democratic |
97,017 |
16.56% | 0 | 0.0% |
 | Uncommitted | - | Democratic |
27,836 |
4.75% | 0 | 0.0% |
| Tom Harkin | Iowa | Democratic |
6,265 |
1.07% | 0 | 0.0% |
| Robert Kerrey | Nebraska | Democratic |
3,219 |
0.55% | 0 | 0.0% |
| Lyndon H. La Rouche, Jr. | Virginia | Democratic |
2,049 |
0.35% | 0 | 0.0% |
| Write-ins | - | Democratic |
906 |
0.15% | 0 | 0.0% |
 |
Map Key
| Turnout
 |  |  |
|
| Maps | 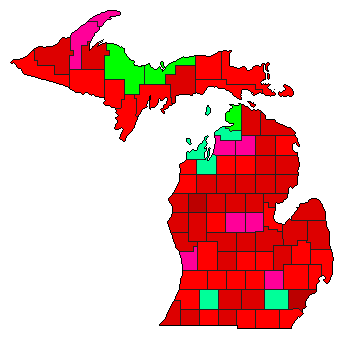 |  | | Pop. (m) | | Dem. (m) | | Dem. (m) | | Dem. (m) |
| |
| | Election Information: | | Contest Type: | State-run Primary | | Election Date: | 1992-03-17 | | Eligible Participants: | Closed (only members of the party) | | Delegates Awarded in this Contest: | 0 | | Delegates Total: | 0 | | Delegate Allocation Method: Statewide Winner-take-all |
|
| Demographic Data
| 2000 Population: | 9,938,444 | Enum. | 2000 Population Density: | 67.6 | persons/km2 | | 1992 Population: | 9,479,065 | Est. | 1992 Population Density: | 64.4 | persons/km2 | | 1990 Population: | 9,295,287 | Enum. | 1990 Population Density: | 63.2 | persons/km2 | | Total Delegates: | 0 | | Delegates Density: | | persons/Del | | Land Area (2000): | 147,121 | km2 | Annual Pop Growth Rate: | 0.7 | % |
| Election Data and Statistics:
| Election Tools
|
| |


