Home
2024
Election Results
Election Info
Weblog
Forum
Wiki
Search
Email
Login
Site Info
Store
1948 Attorney General Democratic Primary Election Results - Minnesota
Note: The Google advertisement links below may advocate political positions that this site does not endorse.
Data for this Contest was Contributed by on 2019-07-25
Attorney General
Candidate
Political
Party
Popular Vote
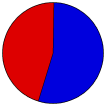
Francis M. Smith
Democratic-F.L.
107,646
54.21%
Jack N. Omvedt
Democratic-F.L.
90,928
45.79%
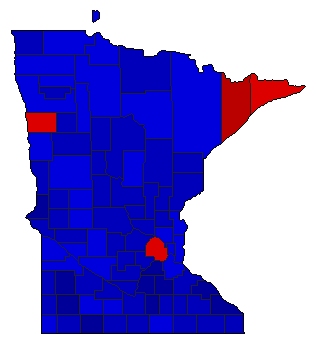
Map Key
> 40%
> 50%
> 60%
> 70%
Turnout
Maps
Demographic Data
1950 Population:
2,982,483
Enum.
1950 Population Density:
14.5
persons/km
2
1940 Population:
2,792,300
Enum.
1940 Population Density:
13.5
persons/km
2
Land Area (2000):
206,189
km
2
Annual Pop Growth Rate:
0.7
%
Election Data and Statistics:
County Data (Table)
(m)
County Data (Graphs)
(m)
Compare State Maps by Year
View All 1948 Minnesota Maps
Election Tools
Atlas Forum
Image Code for Maps:
County
Data Sources:
Source for Popular Vote data: Minnesota Secretary of State.
Minnesota Legislative Manual 1949
, Minnesota Secretary of State (https://www.leg.state.mn.us/archive/sessions/electionresults/1948-11-02-g-man.pdf) (accessed 24 Jul 2019)
Source for Population data: U.S. Census Bureau.
Results for and Individual County:
(m)
Choose Year
2018
2014
2010
2006
2002
1998
1994
1990
1986
1982
1978
1974
1956
1954
1952
1950
1946
Choose Office
Senator
Governor
Lt. Governor
Secretary of State
State Treasurer
Choose State
Minnesota Election Results Home
-
National Results for 1948
-
Use Frame Navigation
Login
Terms of Use
-
DCMA Policy
-
Privacy Policy and Cookies
©
Dave Leip's Atlas of U.S. Elections, LLC 2019 All Rights Reserved


