Home
2024
Election Results
Election Info
Weblog
Forum
Wiki
Search
Email
Login
Site Info
Store
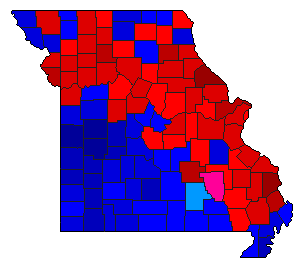
1976 Gubernatorial Democratic Primary Election Results - Missouri
Note: The Google advertisement links below may advocate political positions that this site does not endorse.
Data for this Contest was Contributed by on 2007-05-05
Gubernatorial
Candidate
Political
Party
Popular Vote
Joseph P. Teasdale
Democratic
419,656
50.36%
William (Bill) Cason
Democratic
340,208
40.83%
Byron (Jim) Sparks
Democratic
18,180
2.18%
Milton Morris
Democratic
12,539
1.50%
Roy Bean
Democratic
11,568
1.39%
George D. (Boots) Weber
Democratic
10,746
1.29%
Charles Baker
Democratic
9,735
1.17%
Douglas V. White
Democratic
5,779
0.69%
Roy Smith
Democratic
4,842
0.58%
Map Key
> 30%
> 40%
> 50%
> 60%
> 70%
Turnout
Maps
Pop. (m)
Demographic Data
1980 Population:
4,916,766
Enum.
1980 Population Density:
27.6
persons/km
2
1976 Population:
4,823,554
Est.
1976 Population Density:
27.0
persons/km
2
1970 Population:
4,677,623
Enum.
1970 Population Density:
26.2
persons/km
2
Land Area (2000):
178,414
km
2
Annual Pop Growth Rate:
0.5
%
Election Data and Statistics:
County Data (Table)
(m)
County Data (Graphs)
Compare State Maps by Year
View All 1976 Missouri Maps
Election Tools
Atlas Forum
Image Code for Maps:
County
,
Pop
Data Sources:
Source for Popular Vote data: Missouri Secretary of State, "General Election Returns,"
Missouri Blue Book, 1977-1978
(Jefferson City, 1977)
Source for Population data: U.S. Census Bureau.
Results for and Individual County:
(m)
Choose Year
2020
2016
2012
2008
2004
1992
1988
1984
1980
1972
1964
1952
1948
1944
1940
1936
1932
1928
Choose Office
Senator
Choose State
Illinois
Washington
West Virginia
Missouri Election Results Home
-
National Results for 1976
-
Use Frame Navigation
Login
Terms of Use
-
DCMA Policy
-
Privacy Policy and Cookies
©
Dave Leip's Atlas of U.S. Elections, LLC 2019 All Rights Reserved


