| |
Presidential
Candidate | Vice Presidential
Candidate | Political
Party | Popular Vote | Electoral Vote |
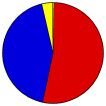
 | Barack H. Obama | Joseph R. Biden, Jr. | Democratic |
415,335 |
52.99% | 5 |
 | Willard Mitt Romney | Paul Ryan | Republican |
335,788 |
42.84% | 0 |
 | Gary Johnson | James P. Gray | Libertarian |
27,787 |
3.55% | 0 |
| Jill Stein | Cheri Honkala | Green |
2,691 |
0.34% | 0 |
| Other (+) | - | - |
2,156 |
0.28% | 0 |
 |
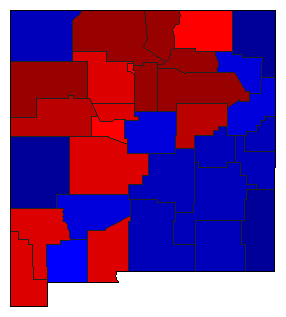
Map Key
| Turnout
 |  |  |
|
|
| Demographic Data
| 2012 Population: | 2,087,715 | Est. | 2012 Population Density: | 6.6 | persons/km2 | | 2010 Population: | 2,059,179 | Enum. | 2010 Population Density: | 6.6 | persons/km2 | | Total Electoral Vote: | 5 | | Electoral Vote Density: | 417,543 | persons/EV | | Land Area (2000): | 314,309 | km2 | Annual Pop Growth Rate: | 0.7 | % |
| Election Data and Statistics:
| Election Tools
- Atlas Forum Image Code for Maps: County, CD, Pop, Tnd, Swg
Data Sources:
- Source for Popular Vote data: New Mexico Office of the Secretary of State Bureau of Elections. Canvass of Returns of General Election Held on November 6, 2012 - State of New Mexico, New Mexico Office of the Secretary of State Bureau of Elections (http://www.sos.state.nm.us/uploads/files/2012%20Statewide%20General%20Results.pdf
) (accessed 12 Dec 2012)
- Source for Population data: U.S. Census Bureau.
| Results for and Individual County:
| | Primary Documentation:
|
| The 2012 Campaign:
|
|
| |


