Home
2024
Election Results
Election Info
Weblog
Forum
Wiki
Search
Email
Login
Site Info
Store
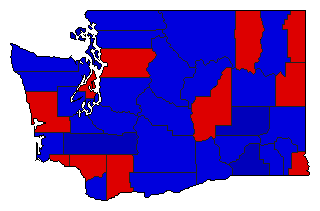
1952 Attorney General General Election Results - Washington
Note: The Google advertisement links below may advocate political positions that this site does not endorse.
Data for this Contest was Contributed by on 2011-12-29
Attorney General
Candidate
Political
Party
Popular Vote
Don Eastvold
Republican
540,138
52.54%
Smith Troy
Democratic
487,859
47.46%
Map Key
> 40%
> 50%
> 60%
> 70%
Turnout
Maps
Demographic Data
1960 Population:
2,853,214
Enum.
1960 Population Density:
16.6
persons/km
2
1950 Population:
2,378,963
Enum.
1950 Population Density:
13.8
persons/km
2
Land Area (2000):
172,348
km
2
Annual Pop Growth Rate:
1.8
%
Election Data and Statistics:
County Data (Table)
(m)
County Data (Graphs)
(m)
Compare State Data by Year (Table)
Compare State Data by Year (Graphs)
View All 1952 Washington Data
Compare State Maps by Year
View All 1952 Washington Maps
Election Tools
Atlas Forum
Image Code for Maps:
County
Data Sources:
Source for Popular Vote data: Washington Secretary of State.
November 1952 General
, Washington Secretary of State (http://www.sos.wa.gov/elections/results_report.aspx?e=62&c=&c2=&t=&t2=&p=&p2=&y=) (accessed 29 Dec 2011)
Source for Population data: U.S. Census Bureau.
Results for and Individual County:
(m)
Choose Year
2020
2016
2012
2008
2004
2000
1996
1992
1988
1984
1980
1976
1972
1968
1964
1960
1956
1948
1944
1940
1936
1932
1928
1924
1920
1916
1912
1908
1904
1900
1896
1892
1889
Choose Office
President
Senator
Governor
Lt. Governor
Secretary of State
State Treasurer
Comptroller General
State Auditor
Insurance Commissioner
Choose State
Arizona
Colorado
Kansas
Massachusetts
Michigan
Minnesota
North Dakota
Oregon
Rhode Island
South Dakota
West Virginia
Washington Election Results Home
-
National Results for 1952
-
Use Frame Navigation
Login
Terms of Use
-
DCMA Policy
-
Privacy Policy and Cookies
©
Dave Leip's Atlas of U.S. Elections, LLC 2019 All Rights Reserved


