| |
Presidential
Candidate | Home State | Political
Party | Primary Vote | Delegates |
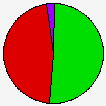
 | Barack Obama | Illinois | Democratic |
179,742 |
50.70% | 26 | 43.3% |
 | Hillary Clinton | New York | Democratic |
165,426 |
46.66% | 22 | 36.7% |
 | John Edwards | North Carolina | Democratic |
3,424 |
0.97% | 0 | 0.0% |
| Uncommitted | - | Democratic |
3,038 |
0.86% | 0 | 0.0% |
| Chris Dodd | Connecticut | Democratic |
912 |
0.26% | 0 | 0.0% |
| Other (+) | - | Democratic |
1,997 |
0.56% | 0 | 0% |
 | Unallocated | - | Democratic |
- |
- | 12 | 20.0% |
 |
Map Key
| Turnout
 |  |  |
|
|
| | Election Information: | | Contest Type: | State-run Primary | | Election Date: | 2008-02-05 | | Eligible Participants: | Closed (only members of the party) | | Delegates Awarded in this Contest: | 48 | | Delegates Total: | 60 | | Delegate Allocation Method: Proportional - the candidates are awarded delegates in proportion to the percentage of votes received. A 15% threshold is required to receive delegates. |
- 17 at-large delegates
- 31 district delegates
- 12 unpledged delegates
- Congressional District 1: 7 delegates
- Congressional District 2: 6 delegates
- Congressional District 3: 7 delegates
- Congressional District 4: 5 delegates
- Congressional District 5: 6 delegates
|
|
| Demographic Data
| 2010 Population: | 3,574,097 | Enum. | 2010 Population Density: | 284.8 | persons/km2 | | 2008 Population: | 3,545,579 | Est. | 2008 Population Density: | 282.6 | persons/km2 | | 2000 Population: | 3,405,565 | Enum. | 2000 Population Density: | 271.4 | persons/km2 | | Total Delegates: | 60.0 | | Delegates Density: | 59,093 | persons/Del | | Land Area (2000): | 12,548 | km2 | Annual Pop Growth Rate: | 0.5 | % |
| Election Data and Statistics:
| Election Tools
|
| |


