| |
Presidential
Candidate | Home State | Political
Party | Primary Vote | Delegates |
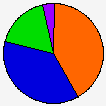
 | Mike Huckabee | Arkansas | Republican |
227,766 |
41.25% | 26 | 54.2% |
 | John McCain | Arizona | Republican |
204,867 |
37.10% | 19 | 39.6% |
 | Mitt Romney | Massachusetts | Republican |
98,019 |
17.75% | 0 | 0.0% |
 | Ron Paul | Texas | Republican |
14,810 |
2.68% | 0 | 0.0% |
| Rudolph W. Giuliani | New York | Republican |
2,134 |
0.39% | 0 | 0.0% |
| Fred Thompson | Tennessee | Republican |
1,835 |
0.33% | 0 | 0.0% |
| Other (+) | - | Republican |
2,724 |
0.49% | 0 | 0% |
 | Unallocated | - | Republican |
- |
- | 3 | 6.3% |
 |
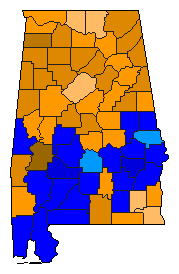
Map Key
| Turnout
 |  |  |
|
|
| | Election Information: | | Contest Type: | State-run Primary | | Election Date: | 2008-02-05 | | Eligible Participants: | Open (all voters) | | Delegates Awarded in this Contest: | 45 | | Delegates Total: | 48 | | Delegate Allocation Method: Top-two in each district, Proportional statewide - with a 15% threshold. |
- 24 at-large delegates are allocated proportionally to candidates based on the percentage of votes received statewide. A 15 percent minimum threshold is required to receive delegates.
- 21 district delegates (3 for each of the 7 congressional districts): In each district, if a candidate receives a majority of the vote, that candidate is awarded all three delegates. If no candidate receives a majority of the vote, then the candidate receiving a plurality of the vote is awarded two delegates and the candidate with the next highest number of votes is awarded one delegate.
|
|
| Demographic Data
| 2010 Population: | 4,779,736 | Enum. | 2010 Population Density: | 36.4 | persons/km2 | | 2008 Population: | 4,718,206 | Est. | 2008 Population Density: | 35.9 | persons/km2 | | 2000 Population: | 4,447,100 | Enum. | 2000 Population Density: | 33.8 | persons/km2 | | Total Delegates: | 48 | | Delegates Density: | 98,296 | persons/Del | | Land Area (2000): | 131,426 | km2 | Annual Pop Growth Rate: | 0.7 | % |
| Election Data and Statistics:
| Election Tools
|
| |


