| |
Presidential
Candidate | Home State | Political
Party | Caucus Result | Delegates |
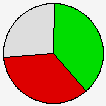
 | Barack Obama | Illinois | Democratic |
4,844 |
45.09% | 13 | 38.2% |
 | Hillary Clinton | New York | Democratic |
5,459 |
50.82% | 12 | 35.3% |
 | John Edwards | North Carolina | Democratic |
399 |
3.71% | 0 | 0.0% |
 | Uncommitted | - | Democratic |
34 |
0.32% | 0 | 0.0% |
| Other (+) | - | Democratic |
6 |
0.06% | 0 | 0% |
 | Unallocated | - | Democratic |
- |
- | 9 | 26.5% |
 |
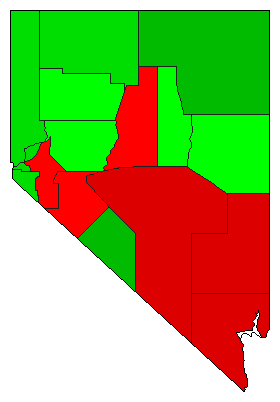
Map Key
| Turnout
 |  |  |
|
|
| | Election Information: | | Contest Type: | Party-run Caucus/Convention | | Caucus Date: | 2008-01-19 | | Eligible Participants: | Closed (only members of the party) | | Delegates Awarded in this Contest: | 25 | | Delegates Total: | 34 | | Delegate Allocation Method: Proportional - the candidates are awarded delegates in proportion to the percentage of votes received. A 15% threshold is required to receive delegates. |
- No actual convention delegates are awarded at the caucuses, rather each precinct caucus chooses delegates to attend the County Conventions.
- Current Delegate Count is only an estimate. Actual Delegates are chosen at the State Convention in April
- 9 at-large delegates are chosen at the State Convention on April 19
- 16 district delegates are chosen at the State Convention on April 19
- 8 unpledged delegates
- Congressional District 1: 6 delegates
- Congressional District 2 (Washoe County): 3 delegates
- Congressional District 2 (Rural Counties): 1 delegate
- Congressional District 2 (Clark County): 2 delegates
- Congressional District 3: 4 delegates
|
|
| Demographic Data
| 2010 Population: | 2,700,551 | Enum. | 2010 Population Density: | 9.5 | persons/km2 | | 2008 Population: | 2,653,630 | Est. | 2008 Population Density: | 9.3 | persons/km2 | | 2000 Population: | 1,998,257 | Enum. | 2000 Population Density: | 7.0 | persons/km2 | | Total Delegates: | 34.0 | | Delegates Density: | 78,048 | persons/Del | | Land Area (2000): | 284,448 | km2 | Annual Pop Growth Rate: | 3.1 | % |
| Election Data and Statistics:
| Election Tools
|
| |


