| |
Presidential
Candidate | Vice Presidential
Candidate | Political
Party | Popular Vote | Electoral Vote |
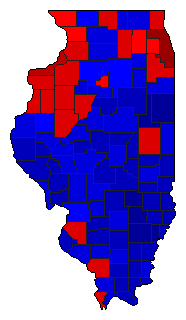
 | Barack H. Obama | Joseph R. Biden, Jr. | Democratic |
3,019,512 |
57.50% | 20 |
 | Willard Mitt Romney | Paul Ryan | Republican |
2,135,216 |
40.66% | 0 |
 | Gary Johnson | James P. Gray | Libertarian |
56,229 |
1.07% | 0 |
| Jill Stein | Howie Hawkins | Green |
30,222 |
0.58% | 0 |
| Other (+) | - | - |
10,253 |
0.20% | 0 |
 |
Map Key
| Turnout
 |  |  |
|
|
| Election Notes:
- Official Results do not count any write-in votes for candidates that did not register for qualified write-in status. Officially registered write-in votes total 67 votes for 14 candidates. The write-ins votes listed here were collected from each county official report (incomplete data).
| Demographic Data
| 2012 Population: | 12,883,029 | Est. | 2012 Population Density: | 89.5 | persons/km2 | | 2010 Population: | 12,830,632 | Enum. | 2010 Population Density: | 89.1 | persons/km2 | | Total Electoral Vote: | 20 | | Electoral Vote Density: | 644,151 | persons/EV | | Land Area (2000): | 143,961 | km2 | Annual Pop Growth Rate: | 0.2 | % |
| Election Data and Statistics:
| Election Tools
- Atlas Forum Image Code for Maps: County, Town, Pop, Tnd, Swg
Data Sources:
- Source for Popular Vote data: Illinois State Board of Elections, "President and Vice President of the United States," Official Vote November 6, 2012 General Election (Springfield, 2012)
- Source for Population data: U.S. Census Bureau.
| Results for and Individual County:
| | Primary Documentation:
|
| The 2012 Campaign:
|
|
| |


