| |
Presidential
Candidate | Vice Presidential
Candidate | Political
Party | Popular Vote | Electoral Vote |
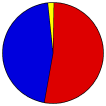
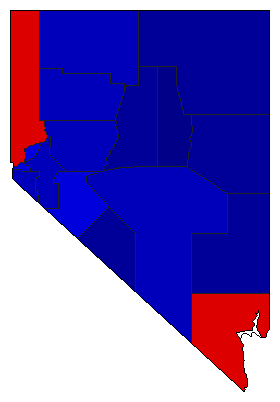
 | Barack H. Obama | Joseph R. Biden, Jr. | Democratic |
531,373 |
52.36% | 6 |
 | Willard Mitt Romney | Paul Ryan | Republican |
463,567 |
45.68% | 0 |
 | Gary Johnson | James P. Gray | Libertarian |
10,968 |
1.08% | 0 |
| None of these Candidates | | |
5,770 |
0.57% | 0 |
| Virgil H. Goode, Jr. | James N. Clymer | Ind. American |
3,240 |
0.32% | 0 |
 |
Map Key
| Turnout
 |  |  |
|
|
| Demographic Data
| 2012 Population: | 2,744,670 | Est. | 2012 Population Density: | 9.6 | persons/km2 | | 2010 Population: | 2,700,551 | Enum. | 2010 Population Density: | 9.5 | persons/km2 | | Total Electoral Vote: | 6 | | Electoral Vote Density: | 457,445 | persons/EV | | Land Area (2000): | 284,448 | km2 | Annual Pop Growth Rate: | 0.8 | % |
| Election Data and Statistics:
| Election Tools
- Atlas Forum Image Code for Maps: County, CD, Pop, Tnd, Swg
Data Sources:
- Source for Popular Vote data: Nevada Secretary of State Elections Division. 2012 Official Statewide General Election Results November 6, 2012 President and Vice President of the United States, Nevada Secretary of State Elections Division (http://www.nvsos.gov/soselectionpages/results/2012STatewideGeneral/ElectionSummary.aspx
) (accessed 28 Nov 2012)
- Source for Population data: U.S. Census Bureau.
| Results for and Individual County:
| | Primary Documentation:
|
| The 2012 Campaign:
|
|
| |


