| |
Senatorial
Candidate | Political
Party | Popular Vote |
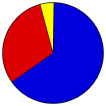
 | Bob Corker | Republican |
1,506,443 |
64.89% |
 | Mark E. Clayton | Democratic |
705,882 |
30.41% |
 | Martin Pleasant | Green |
38,472 |
1.66% |
| Dr. Shaun Crowell | Independent |
20,936 |
0.90% |
| Kermit Steck | Constitution |
18,620 |
0.80% |
| James Higdon | Independent |
8,085 |
0.35% |
| Michel Joseph Long | Independent |
8,080 |
0.35% |
| Troy Stephen Scoggin | Independent |
7,148 |
0.31% |
| David Gatchell | Independent |
6,523 |
0.28% |
| Write-ins | - |
1,288 |
0.06% |
 |
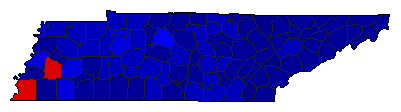
Map Key
| > 40% |
 |
 |
| > 50% |
 |
 |
| > 60% |
|
 |
| > 70% |
|
 |
| > 80% |
|
 |
| Turnout
 |  |
|
|
| Demographic Data
| 2012 Population: | 6,455,752 | Est. | 2012 Population Density: | 60.5 | persons/km2 | | 2010 Population: | 6,346,105 | Enum. | 2010 Population Density: | 59.4 | persons/km2 | | Land Area (2000): | 106,752 | km2 | Annual Pop Growth Rate: | 0.9 | % |
| Election Data and Statistics:
| Election Tools
- Atlas Forum Image Code for Maps: County, Pop, Tnd, Swg
Data Sources:
- Source for Popular Vote data: Tennessee Secretary of State. Division of Elections. November 6, 2012 Official Results, Tennessee Secretary of State. Division of Elections (http://www.tn.gov/sos/election/results/2012-11/USSenateCountyTotals.pdf
) (accessed 10 Dec 2012)
- Source for Population data: U.S. Census Bureau.
| Results for and Individual County:
| | Primary Documentation:
|
| The 2012 Campaign:
|
|
| |


