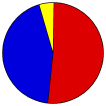
2000 Presidential General Election Results - Niagara County, NY
Note: The Google advertisement links below may advocate political positions that this site does not endorse.
 Presidential
Candidate
Vice Presidential
Candidate
Political
Party
Popular Vote
Albert Gore Jr.Joseph LiebermanDemocratic 47,781 51.23%
George W. BushRichard CheneyRepublican 40,952 43.91%
Ralph NaderWinona LaDukeGreen 3,257 3.49%
Patrick BuchananEzola FosterRight to Life 770 0.83%
John HagelinA. Nat. GoldhaberIndependence 344 0.37%
YOther (+) - - 166 0.18%
Seal Map Key
 > 40%
 > 50%
 > 60%
 > 70%
Turnout
Voter Turnout Graph
Pie Chart
MapsCounty Township Map (m)
Town
Last Button
Per Vote Democratic Button
Per Vote Republican Button
Swing Map Button
Trend Map Button
 
Demographic Data

2000 Population:219,846Enum.2000 Population Density:162.4persons/km2
1990 Population:220,756Enum.1990 Population Density:163.0persons/km2
Land Area (2000):1,354km2Annual Pop Growth Rate:-0.0%

Data and Statistics:
  • City and Town Data (Table) (m)
  • City and Town Data (Graphs) (m)
  • Precinct Data (Table) (m)
  • Compare County Data by Year (Table) (m)
  • Compare County Data by Year (Graphs) (m)
  • Compare County Maps by Year (m)
Election Notes:
  • Gore vote is the fusion of Democratic Liberal and Working Families parties.
  • Bush vote is the fusion of Republican and Conservative parties.
  • Buchanan vote is the fusion of Right to Life and Buchanan Reform parties.


National Results for 2000 - New York Results for 2000 - Use Frame Navigation

Login

Terms of Use - DCMA Policy - Privacy Policy and Cookies


© Dave Leip's Atlas of U.S. Elections, LLC 2019 All Rights Reserved
North Tonawanda City 36063 Niagara Falls City 36063 Niagara Town 36063 Wheatfield Town 36063 Pendleton Town 36063 Lockport City 36063 Royalton Town 36063 Lockport Town 36063 Lewiston Town 36063 Cambria Town 36063 Porter Town 36063 Hartland Town 36063 Wilson Town 36063 Newfane Town 36063 Somerset Town 36063