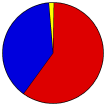
2012 Presidential General Election Results - Onondaga County, NY
Note: The Google advertisement links below may advocate political positions that this site does not endorse.
 Presidential
Candidate
Vice Presidential
Candidate
Political
Party
Popular Vote
Barack H. ObamaJoseph R. Biden, Jr.Democratic 122,254 59.72%
Willard Mitt RomneyPaul RyanRepublican 78,831 38.51%
Gary JohnsonJames P. GrayLibertarian 1,697 0.83%
Jill SteinCheri HonkalaGreen 1,584 0.77%
YOther (+) - - 351 0.17%
Seal Map Key
 > 40%
 > 50%
 > 60%
 > 70%
Turnout
Voter Turnout Graph
Pie Chart
MapsCounty Township Map (m)
Town
Last Button
Per Vote Democratic Button
Per Vote Republican Button
Swing Map Button
Trend Map Button
 
Demographic Data

2012 Population:467,138Est.2012 Population Density:231.1persons/km2
2010 Population:467,026Enum.2010 Population Density:231.1persons/km2
Land Area (2000):2,021km2Annual Pop Growth Rate:0.0%

Data and Statistics:
  • City and Town Data (Table) (m)
  • City and Town Data (Graphs) (m)
  • Precinct Data (Table) (m)
  • Compare County Data by Year (Table) (m)
  • Compare County Data by Year (Graphs) (m)
  • Compare County Maps by Year (m)
Election Notes:
  • Obama Vote is the Fusion of Democratic and Working Families Parties
  • Romney Vote is the Fusion of Republican and Conservative Parties


National Results for 2012 - New York Results for 2012 - Use Frame Navigation

Login

Terms of Use - DCMA Policy - Privacy Policy and Cookies


© Dave Leip's Atlas of U.S. Elections, LLC 2019 All Rights Reserved
Tully Town 36067 Fabius Town 36067 Spafford Town 36067 Otisco Town 36067 LaFayette Town 36067 Pompey Town 36067 Skaneateles Town 36067 Marcellus Town 36067 Onondaga Town 36067 Syracuse City 36067 Camillus Town 36067 Elbridge Town 36067 De Witt Town 36067 Manlius Town 36067 Geddes Town 36067 Salina Town 36067 Van Buren Town 36067 Lysander Town 36067 Cicero Town 36067 Clay Town 36067