2018 Gubernatorial General Election Results - Bennington County, VT
Note: The Google advertisement links below may advocate political positions that this site does not endorse.
 Gubernatorial
Candidate
Political PartyPopular Vote
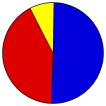
Phil ScottRepublican 7,351 50.05%
Christine HallquistDemocratic 6,152 41.89%
Trevor BarlowIndependent 345 2.35%
Cris EricsonIndependent 297 2.02%
Charles LaramieIndependent 178 1.21%
Emily 'Em' PeytonLiberty Union 163 1.11%
Stephen MarxEarth Rights 134 0.91%
Write-ins- 66 0.45%
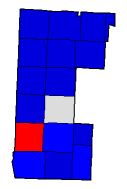
Seal Map Key
 > 40%
 > 50%
 > 60%
 > 70%
Turnout
Voter Turnout Graph
Pie Chart
Maps
2018 County Township Map
Town
Last Button
Per Vote Republican Button
Per Vote Democratic Button
Swing Map Button
Trend Map Button
 
Demographic Data

2010 Population:0Enum.2010 Population Density:0.0persons/km2
Land Area (2000):1,752km2

Data and Statistics:
  • City and Town Data (Table) (m)
  • City and Town Data (Graphs) (m)
  • Precinct Data (Table) (m)
  • Compare County Data by Year (Table) (m)
  • Compare County Data by Year (Graphs) (m)
  • Compare County Maps by Year (m)


National Results for 2018 - Vermont Results for 2018 - Use Frame Navigation

Login

Terms of Use - DCMA Policy - Privacy Policy and Cookies


© Dave Leip's Atlas of U.S. Elections, LLC 2019 All Rights Reserved
Stamford Town 50003 Pownal Town 50003 Readsboro Town 50003 Searsburg Town 50003 Woodford Town 50003 Bennington Town 50003 Shaftsbury Town 50003 Sunderland Town 50003 Arlington Town 50003 Winhall Town 50003 Manchester Town 50003 Sandgate Town 50003 Landgrove Town 50003 Peru Town 50003 Dorset Town 50003 Rupert Town 50003