2018 Gubernatorial General Election Results - Essex County, VT
Note: The Google advertisement links below may advocate political positions that this site does not endorse.
 Gubernatorial
Candidate
Political PartyPopular Vote
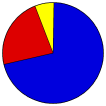
Phil ScottRepublican 1,573 70.98%
Christine HallquistDemocratic 506 22.83%
Trevor BarlowIndependent 43 1.94%
Cris EricsonIndependent 28 1.26%
Charles LaramieIndependent 26 1.17%
Emily 'Em' PeytonLiberty Union 18 0.81%
Stephen MarxEarth Rights 16 0.72%
Write-ins- 6 0.27%
Seal Map Key
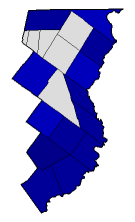
 > 50%
 > 60%
 > 70%
 > 80%
Turnout
Voter Turnout Graph
Pie Chart
Maps
2018 County Township Map
Town
Last Button
Per Vote Republican Button
Per Vote Democratic Button
Swing Map Button
Trend Map Button
 
Demographic Data

2010 Population:0Enum.2010 Population Density:0.0persons/km2
Land Area (2000):1,723km2

Data and Statistics:
  • City and Town Data (Table) (m)
  • City and Town Data (Graphs) (m)
  • Precinct Data (Table) (m)
  • Compare County Data by Year (Table) (m)
  • Compare County Data by Year (Graphs) (m)
  • Compare County Maps by Year (m)


National Results for 2018 - Vermont Results for 2018 - Use Frame Navigation

Login

Terms of Use - DCMA Policy - Privacy Policy and Cookies


© Dave Leip's Atlas of U.S. Elections, LLC 2019 All Rights Reserved
Concord Town 50009 Lunenburg Town 50009 Victory Town 50009 Guildhall Town 50009 Granby Town 50009 East Haven Town 50009 Maidstone Town 50009 Brunswick Town 50009 Brighton Town 50009 Bloomfield Town 50009 Lemington Town 50009 Norton Town 50009 Canaan Town 50009