2018 Gubernatorial General Election Results - Washington County, VT
Note: The Google advertisement links below may advocate political positions that this site does not endorse.
 Gubernatorial
Candidate
Political PartyPopular Vote
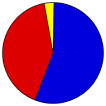
Phil ScottRepublican 15,182 55.38%
Christine HallquistDemocratic 11,340 41.37%
Trevor BarlowIndependent 211 0.77%
Stephen MarxEarth Rights 174 0.63%
Emily 'Em' PeytonLiberty Union 154 0.56%
Cris EricsonIndependent 133 0.49%
Write-ins- 113 0.41%
Charles LaramieIndependent 105 0.38%
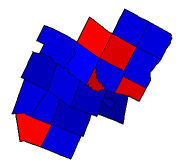
Seal Map Key
 > 40%
 > 50%
 > 60%
 > 70%
Turnout
Voter Turnout Graph
Pie Chart
Maps
2018 County Township Map
Town
Last Button
Per Vote Republican Button
Per Vote Democratic Button
Swing Map Button
Trend Map Button
 
Demographic Data

2010 Population:0Enum.2010 Population Density:0.0persons/km2
Land Area (2000):1,785km2

Data and Statistics:
  • City and Town Data (Table) (m)
  • City and Town Data (Graphs) (m)
  • Precinct Data (Table) (m)
  • Compare County Data by Year (Table) (m)
  • Compare County Data by Year (Graphs) (m)
  • Compare County Maps by Year (m)


National Results for 2018 - Vermont Results for 2018 - Use Frame Navigation

Login

Terms of Use - DCMA Policy - Privacy Policy and Cookies


© Dave Leip's Atlas of U.S. Elections, LLC 2019 All Rights Reserved
Roxbury Town 50023 Warren Town 50023 Northfield Town 50023 Barre City 50023 Waitsfield Town 50023 Barre Town 50023 Berlin Town 50023 Fayston Town 50023 Plainfield Town 50023 Montpelier City 50023 Moretown Town 50023 East Montpelier Town 50023 Duxbury Town 50023 Marshfield Town 50023 Middlesex Town 50023 Calais Town 50023 Waterbury Town 50023 Cabot Town 50023 Worcester Town 50023 Woodbury Town 50023