This article is actively undergoing a major edit.
As a courtesy, please do not edit this article while this message is displayed. The person who added this notice will be listed in its edit history should you wish to contact him or her.
The 2000 U.S. General Election was held on November 7, 2000.
Presidential Election
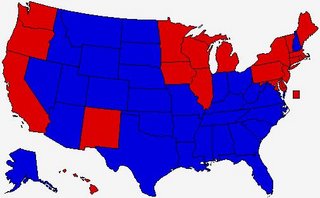
Results -- blue represents Bush states, red represents Gore states.
In one of the closest presidential elections in U.S. history, Democrat Al Gore barely lost to Republican George W. Bush. After a close and controversial vicotry for Bush in Florida, he defeated Gore by a margin of 271 to 266, with one DC elector refusing to vote for Gore. This defeat was twice as punishing on Gore as he actually won the popular vote 51,003,926 to 50,460,110.
|
|
Presidential Candidate
|
Vice Presidential Candidate
|
Party
|
Popular Votes
|
Popular Vote %
|
Electoral Votes
|
Won
|
|
|
George W. Bush
|
Dick Cheney
|
Republican
|
50,460,110
|
47.9%
|
271
|

|
|
|
Al Gore
|
Joe Lieberman
|
Democratic
|
51,003,926
|
48.4%
|
266
|
|
|
|
Ralph Nader
|
Winona LaDuke
|
Green
|
2,883,105
|
2.7%
|
0
|
|
|
|
Patrick Buchanan
|
Ezola Foster
|
Reform
|
449,225
|
0.4%
|
0
|
|
|
|
Harry Browne
|
Art Olivier
|
Libertarian
|
384,516
|
0.4%
|
0
|
|
|
|
Others
|
-
|
-
|
211,803
|
0.2%
|
0
|
|
|
|
Write-ins
|
-
|
-
|
24,790
|
0%
|
0
|
|
Results by State
Alabama
|
|
Presidential Candidate
|
Vice Presidential Candidate
|
Party
|
Votes
|
Vote %
|
Electoral Votes
|
Won
|
|
|
George W. Bush
|
Dick Cheney
|
Republican
|
944,409
|
56.5%
|
9
|
|
|
|
Al Gore
|
Joe Lieberman
|
Democratic
|
695,602
|
41.6%
|
|
|
|
|
Ralph Nader
|
Winona LaDuke
|
-
|
18,349
|
1.1%
|
|
|
|
|
Others
|
-
|
-
|
32,658
|
0.9%
|
|
|
Alaska
|
|
Presidential Candidate
|
Vice Presidential Candidate
|
Party
|
Votes
|
Vote %
|
Electoral Votes
|
Won
|
|
|
George W. Bush
|
Dick Cheney
|
Republican
|
167,398
|
58.6%
|
3
|
|
|
|
Al Gore
|
Joe Lieberman
|
Democratic
|
79,004
|
27.7%
|
|
|
|
|
Ralph Nader
|
Winona LaDuke
|
Green
|
28,747
|
10.1%
|
|
|
|
|
Others
|
-
|
-
|
10,411
|
3.7%
|
|
|
Arizona
|
|
Presidential Candidate
|
Vice Presidential Candidate
|
Party
|
Votes
|
Vote %
|
Electoral Votes
|
Won
|
|
|
George W. Bush
|
Dick Cheney
|
Republican
|
781,652
|
51%
|
8
|
|
|
|
Al Gore
|
Joe Lieberman
|
Democratic
|
685,341
|
44.7%
|
|
|
|
|
Ralph Nader
|
Winona LaDuke
|
Green
|
45,645
|
3%
|
|
|
|
|
Others
|
-
|
-
|
21,475
|
1.4%
|
|
|
Arkansas
|
|
Presidential Candidate
|
Vice Presidential Candidate
|
Party
|
Votes
|
Vote %
|
Electoral Votes
|
Won
|
|
|
George W. Bush
|
Dick Cheney
|
Republican
|
|
%
|
6
|
|
|
|
Al Gore
|
Joe Lieberman
|
Democratic
|
|
%
|
|
|
|
|
Ralph Nader
|
Winona LaDuke
|
-
|
|
%
|
|
|
|
|
Others
|
-
|
-
|
|
%
|
|
|
California
|
|
Presidential Candidate
|
Vice Presidential Candidate
|
Party
|
Votes
|
Vote %
|
Electoral Votes
|
Won
|
|
|
Al Gore
|
Joe Lieberman
|
Democratic
|
5,861,203
|
53.5%
|
54
|
|
|
|
George W. Bush
|
Dick Cheney
|
Republican
|
4,567,429
|
41.7%
|
|
|
|
|
Ralph Nader
|
Winona LaDuke
|
-
|
418,707
|
3.8%
|
|
|
|
|
Others
|
-
|
-
|
118,517
|
1.1%
|
|
|
Colorado
|
|
Presidential Candidate
|
Vice Presidential Candidate
|
Party
|
Votes
|
Vote %
|
Electoral Votes
|
Won
|
|
|
George W. Bush
|
Dick Cheney
|
Republican
|
883,745
|
50.8%
|
8
|
|
|
|
Al Gore
|
Joe Lieberman
|
Democratic
|
738,227
|
42.4%
|
|
|
|
|
Ralph Nader
|
Winona LaDuke
|
Green
|
91,434
|
5.3%
|
|
|
|
|
Others
|
-
|
-
|
27,959
|
1.6%
|
|
|
Connecticut
|
|
Presidential Candidate
|
Vice Presidential Candidate
|
Party
|
Votes
|
Vote %
|
Electoral Votes
|
Won
|
|
|
Al Gore
|
Joe Lieberman
|
Democratic
|
|
%
|
|
|
|
|
George W. Bush
|
Dick Cheney
|
Republican
|
|
%
|
|
|
|
|
Ralph Nader
|
Winona LaDuke
|
-
|
|
%
|
|
|
|
|
Others
|
-
|
-
|
|
%
|
|
|
Delaware
|
|
Presidential Candidate
|
Vice Presidential Candidate
|
Party
|
Votes
|
Vote %
|
Electoral Votes
|
Won
|
|
|
Al Gore
|
Joe Lieberman
|
Democratic
|
|
%
|
|
|
|
|
George W. Bush
|
Dick Cheney
|
Republican
|
|
%
|
|
|
|
|
Ralph Nader
|
Winona LaDuke
|
-
|
|
%
|
|
|
|
|
Others
|
-
|
-
|
|
%
|
|
|
District of Columbia
|
|
Presidential Candidate
|
Vice Presidential Candidate
|
Party
|
Votes
|
Vote %
|
Electoral Votes
|
Won
|
|
|
Al Gore
|
Joe Lieberman
|
Democratic
|
|
%
|
|
|
|
|
George W. Bush
|
Dick Cheney
|
Republican
|
|
%
|
|
|
|
|
Ralph Nader
|
Winona LaDuke
|
-
|
|
%
|
|
|
|
|
Others
|
-
|
-
|
|
%
|
|
|
Florida
|
|
Presidential Candidate
|
Vice Presidential Candidate
|
Party
|
Votes
|
Vote %
|
Electoral Votes
|
Won
|
|
|
George W. Bush
|
Dick Cheney
|
Republican
|
|
%
|
|
|
|
|
Al Gore
|
Joe Lieberman
|
Democratic
|
|
%
|
|
|
|
|
Ralph Nader
|
Winona LaDuke
|
Green
|
|
%
|
|
|
|
|
Others
|
-
|
-
|
|
%
|
|
|
Georgia
|
|
Presidential Candidate
|
Vice Presidential Candidate
|
Party
|
Votes
|
Vote %
|
Electoral Votes
|
Won
|
|
|
George W. Bush
|
Dick Cheney
|
Republican
|
|
%
|
|
|
|
|
Al Gore
|
Joe Lieberman
|
Democratic
|
|
%
|
|
|
|
|
Ralph Nader
|
Winona LaDuke
|
Green
|
|
%
|
|
|
|
|
Others
|
-
|
-
|
|
%
|
|
|
U.S. House of Representatives
U.S. Senate
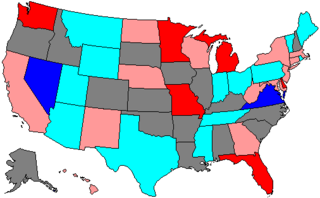
Results -- light blue represents Republican holds, dark blue Republican pickups, pink Democratic holds, red Democratic pickups.
In the Senate, Democrats had a net gain of four seats, creating a tied Senate. This effectively gave Republicans control, since Dick Cheney, who was elected Vice President on the Republican ticket, would break a tie vote. Upon Republican Jim Jeffords' decision to become an Independent in May 2001, the Democrats gained a one-seat majority.
Arizona
|
|
Senatorial Candidate
|
Party
|
Votes
|
Vote %
|
Won
|
|
|
Jon Kyl*
|
Republican
|
1,108,196
|
79.3%
|
|
|
|
William Toel
|
Independent
|
109,230
|
7.8%
|
|
|
|
Vance Hansen
|
Green
|
108,926
|
7.8%
|
|
|
|
Barry J. Hess, III
|
Libertarian
|
70,724
|
5.1%
|
|
California
|
|
Senatorial Candidate
|
Party
|
Votes
|
Vote %
|
Won
|
|
|
Dianne Feinstein*
|
Democratic
|
5,932,522
|
55.8%
|
|
|
|
Tom Campbell
|
Republican
|
3,886,853
|
36.6%
|
|
|
|
Medea S. Benjamin
|
Green
|
326,828
|
3.1%
|
|
|
|
Others
|
-
|
477,405
|
4.5%
|
|
Connecticut
|
|
Senatorial Candidate
|
Party
|
Votes
|
Vote %
|
Won
|
|
|
Joe Lieberman*
|
Democratic
|
828,902
|
63.2%
|
|
|
|
Phil Giordano
|
Republican
|
448,077
|
34.2%
|
|
|
|
Others
|
-
|
34,282
|
2.6%
|
|
Delaware
|
|
Senatorial Candidate
|
Party
|
Votes
|
Vote %
|
Won
|
|
|
Tom Carper
|
Democratic
|
181,566
|
55.5%
|
|
|
|
Bill Roth, Jr.*
|
Republican
|
142,891
|
43.7%
|
|
|
|
Others
|
-
|
2,536
|
0.8%
|
|
Governor
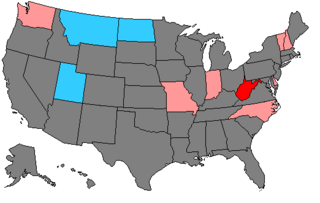
Results -- light blue represents Republican holds, pink Democratic holds, red Democratic pickups.
Delaware
|
|
Gubernatorial Candidate
|
Party
|
Votes
|
Vote %
|
Won
|
|
|
Ruth Minner
|
Democratic
|
191,695
|
59.2%
|
|
|
|
John Burris
|
Republican
|
128,603
|
39.8%
|
|
|
|
Floyd McDowell
|
Independent Party of Delaware
|
3,271
|
1%
|
|
Indiana
|
|
Gubernatorial Candidate
|
Lt. Gubernatorial Candidate
|
Party
|
Votes
|
Vote %
|
Won
|
|
|
Frank O'Bannon*
|
Joe Kernan*
|
Democratic
|
1,232,525
|
56.6%
|
|
|
|
David McIntosh
|
J. Murray Clark
|
Republican
|
908,285
|
41.7%
|
|
|
|
Andrew Horning
|
Mark Schreiber
|
Libertarian
|
38,458
|
1.8%
|
|
Missouri
|
|
Gubernatorial Candidate
|
Party
|
Votes
|
Vote %
|
Won
|
|
|
Bob Holden
|
Democratic
|
1,152,752
|
49.1%
|
|
|
|
Jim Talent
|
Republican
|
1,131,307
|
48.2%
|
|
|
|
Others
|
-
|
62,771
|
2.7%
|
|
Montana
|
|
Gubernatorial Candidate
|
Lt. Gubernatorial Candidate
|
Party
|
Votes
|
Vote %
|
Won
|
|
|
Judy Martz
|
Karl Ohs
|
Republican
|
209,135
|
51%
|
|
|
|
Mark O'Keefe
|
Carol Williams
|
Democratic
|
193,131
|
47.1%
|
|
|
|
Stan Jones
|
Michael Kaszula
|
Libertarian
|
7,926
|
1.9%
|
|
New Hampshire
|
|
Gubernatorial Candidate
|
Party
|
Votes
|
Vote %
|
Won
|
|
|
Jeanne Shaheen*
|
Democratic
|
275,038
|
48.7%
|
|
|
|
Gordon Humphrey
|
Republican
|
246,952
|
43.8%
|
|
|
|
Mary Brown
|
Independent
|
35,904
|
6.4%
|
|
|
|
John J. Babiarz
|
Libertarian
|
6,446
|
1.1%
|
|
North Carolina
|
|
Gubernatorial Candidate
|
Party
|
Votes
|
Vote %
|
Won
|
|
|
Mike Easley
|
Democratic
|
1,530,324
|
52%
|
|
|
|
Richard Vinroot
|
Republican
|
42,674
|
46.3%
|
|
|
|
Barbara Howe
|
Libertarian
|
|
1.5%
|
|
|
|
Douglas Schell
|
Reform
|
8,104
|
0.3%
|
|
North Dakota
|
|
Gubernatorial Candidate
|
Lt. Gubernatorial Candidate
|
Party
|
Votes
|
Vote %
|
Won
|
|
|
John Hoeven
|
Jack Dalrymple
|
Republican
|
159,255
|
55%
|
|
|
|
Heidi Heitkamp
|
Aaron Krauter
|
Democratic-NPL
|
130,144
|
45%
|
|
|
|
Write-ins
|
-
|
-
|
13
|
0%
|
|
Utah
|
|
Gubernatorial Candidate
|
Lt. Gubernatorial Candidate
|
Party
|
Votes
|
Vote %
|
Won
|
|
|
Michael Leavitt*
|
Olene Walker*
|
Republican
|
424,837
|
55.8%
|
|
|
|
Bill Orton
|
Karen Hale
|
Democratic
|
321,979
|
42.3%
|
|
|
|
Jeremy Friedbaum
|
Lee McKenzie
|
Independent American
|
14,990
|
2%
|
|
Vermont
|
|
Gubernatorial Candidate
|
Party
|
Votes
|
Vote %
|
Won
|
|
|
Howard Dean
|
Democratic
|
148,059
|
50.5%
|
|
|
|
Ruth Dwyer
|
Republican
|
111,359
|
38%
|
|
|
|
Anthony Pollina
|
Progressive
|
28,116
|
9.6%
|
|
|
|
Others
|
-
|
4,939
|
2%
|
|
Washington
|
|
Gubernatorial Candidate
|
Party
|
Votes
|
Vote %
|
Won
|
|
|
Gary Locke*
|
Democratic
|
1,441,973
|
58.4%
|
|
|
|
John Carlson
|
Republican
|
980,060
|
39.7%
|
|
|
|
Steve LePage
|
Libertarian
|
47,819
|
1.9%
|
|
|
|
Others
|
-
|
4,939
|
2%
|
|
West Virginia
|
|
Gubernatorial Candidate
|
Party
|
Votes
|
Vote %
|
Won
|
|
|
Bob Wise
|
Democratic
|
324,822
|
50.1%
|
|
|
|
Cecil Underwood*
|
Republican
|
305,926
|
47.2%
|
|
|
|
Others
|
-
|
17,299
|
2.7%
|
|


