


|
Date of Prediction: 2006-11-07 Version:52
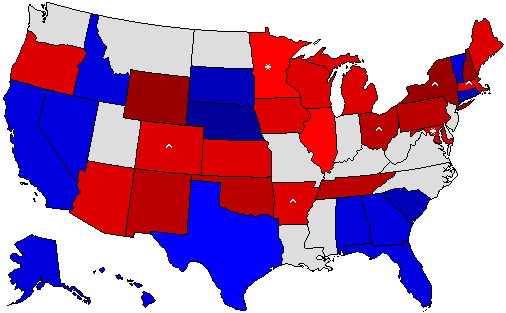
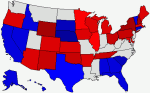
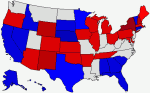
Prediction Map
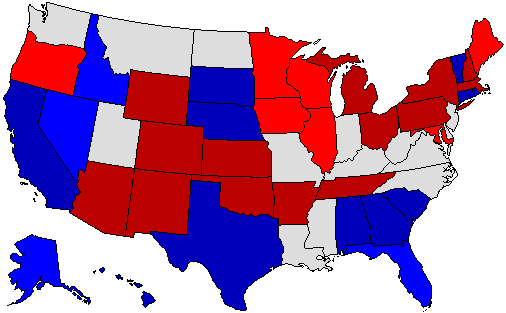
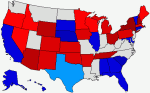
* = Pickup via defeat of incumbent; ^ = Pickup of an open seat Confidence Map
Prediction States Won
Confidence States Won
State Pick-ups
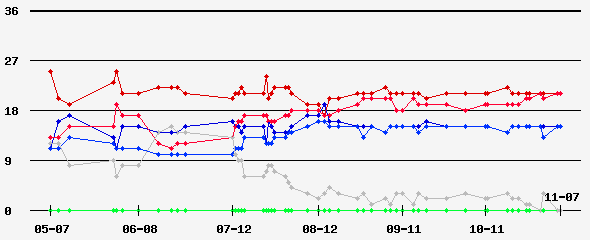
Prediction Score (max Score = 72)
Comments
Definite Final Prediction !
Prediction History
Comments History
- hide
Version: 51 Final prediction ! Version: 47 WI, MI, OR, ME -> Strong Dem. Version: 46 FL -> Lean Rep. Version: 44 RI -> Dem. (just a feeling) Version: 43 AK -> Strong Version: 40 NV, FL -> strong Rep. Version: 39 RI -> Lean Rep. (slightly) Version: 38 MN,IA -> Toss Up Version: 37 MI, IA -> Lean Dem Version: 34 AK -> Leans Rep. Version: 33 RI -> Dem. Version: 32 CA -> Strong Arnieland Version: 31 NV, MN -> Toss-Up Version: 30 MI -> Lean Dem. Version: 28 Back to normal ... Version: 26 IL -> Lean Dem. Version: 17 PA, OH strong Dem. AL lean Rep. Version: 16 Alaska to Lean Dem. Version: 15 R.I. -> Dem. Version: 14 Colorado to Lean Dem. Version: 13 California -> Dem. Version: 12 Maine -> Rep. Version: 11 Minnesota is now my biggest problem, because Zogby shows Pawlenty with about 5% ahead, while Rasmussen shows Hatch ahed by about 10%. I see it as a complete toss-up, but i think Hatch will make the race. Version: 10 California keeps Arnie, RI Carcieri and Wisconsin Doyle. Version: 9 Moved Alabama into Strong Republican and Maryland into Toss-Up, because I think it´ll get closer there as the campaign moves on. Version: 8 Switched Michigan because of new Rasmussen Poll. Version: 7 Switched Colorado because of the new Rasmussen poll. Version: 6 Back to Normal Version: 5 Best Case Scenario Prediction for Democrats - flipped Florida and Michigan to Dems Version: 4 California, Colorado, Illinois to Dems
Version History Member Comments By: Mark Warner 08 (I-AUT) - 2006-11-08 @ 10:57:06
By: RepubforDem (R-IL) - 2006-11-08 @ 12:46:16
By: Mark Warner 08 (I-AUT) - 2006-11-09 @ 01:49:40
By: RepubforDem (R-IL) - 2006-11-11 @ 11:49:57
By: nini2000 (I-PA) - 2006-11-14 @ 10:03:12
User's Predictions
Links
|
|||||||||||||||||||||||||||||||||||||||||||||||||||||||||||||||||||||||||||||||||||||||||||||||||||||||||||||||||||||||||||||||||||||||||||||||||||||||||||||||||||||||||||||||||||||||||||||||||||||||||||||||||||||||||||||||||||||||||||||||||||||||||||||||||||||||||||||||||||||||||||||||||||||||||||||||||||||||||||||||||||||||||||||||||||||||||||||||||||||||||||||||||||||||||||||||||||||||||||||||||||||||||||||||||||||||||||||||||||||||||||||||||||||||||||||||||||||||||||||||||||||||||||||||||||||||||||||||||||||
 2024 President
 2023 Governor
 2022 Senate
 2022 Governor
 2021 Governor
 2020 President
 2020 Senate
 2020 Governor
 2018 Senate
 2018 Governor
 2016 President
 2016 Senate
 2016 Governor
 2015 Governor
 2014 Senate
 2014 Governor
 2013 Governor
 2012 President
 2012 Senate
 2012 Governor
 2012 Rep Primary
 2011 Governor
 2010 Senate
 2010 Governor
 2009 Governor
 2008 President
 2008 Senate
 2008 Governor
 2008 Dem Primary
 2008 Rep Primary
 2007 Governor
 2006 U.S. Senate
 2006 Governor
Back to 2006 Gubernatorial Prediction Home - Predictions Home