PredictionsEndorse2006 Gubernatorial Predictions - htmldon (R-TN) ResultsPolls
Note: The Google advertisement links below may advocate political positions that this site does not endorse.
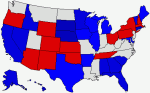
Date of Prediction: 2006-04-19 Version:1
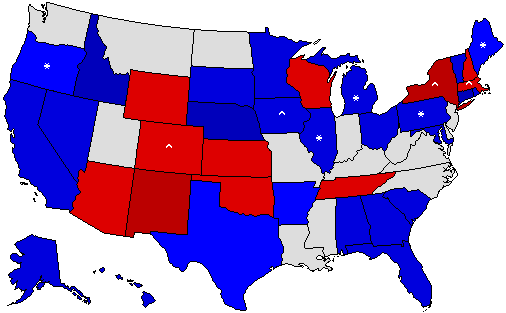
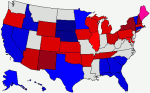
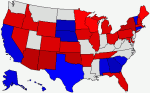
Prediction Map
htmldon MapPrediction Key

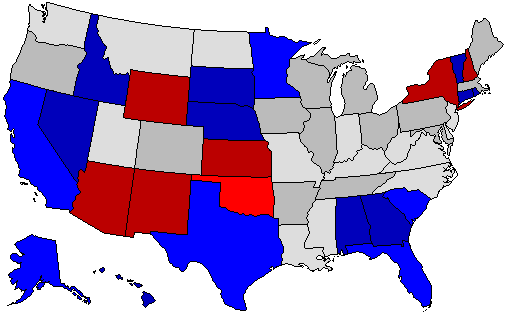
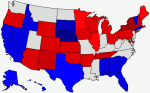
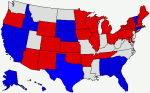
* = Pickup via defeat of incumbent; ^ = Pickup of an open seat

Confidence Map
htmldon MapConfidence Key

Prediction States Won
25 |
36 |
50 |
Dem11
 
pie
Rep25
 
Ind0
 
Non14
 

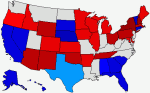
Confidence States Won
25 |
36 |
50 |
Dem7
 
pie
Rep16
 
Ind0
 
Tos13
 
Non14
 

State Pick-ups

Gain Loss Hold Net Gain
Inc. Open Total Inc. Open Total Inc. Open Total
Dem0+3+3-5-1-6808-3
Rep+5+1+60-3-314519+3
Ind0000000000


Prediction Score (max Score = 72)

ScoreState WinsState Percentages
piepiepie

Comments
No Comments Entered

Member Comments

 By: ian (D-AR) - 2006-04-24 @ 15:33:54

Don, when I saw that your map, I automatically thought that your partisanship had gotten the best of you (since yours is the most Republican map), but your map isn't really farfetched. I have absolutely no problem in conceiving this result, even if I really don't want to.prediction Map

 By: MatthewVA (D-VA) - 2006-04-27 @ 01:15:36

I agree that it isn't that farfetched but it really would require a perfect storm against the Democrats. I also don't think it realistic that Jim Doyle would survive at the same time Ed Rendell is defeated.prediction Map

 By: ilikeverin (D-NY) - 2006-04-30 @ 13:15:37

Minnesota as lean Rep? htmldon, you are a silly. 

 By: dubya2004 (I-PA) - 2006-04-30 @ 17:59:08

You just can't get enough of making yourself look foolish, can you?prediction Map

 By: WI_Dem (D-WI) - 2006-05-03 @ 20:33:13

Possible. I don't think it's likely, but possible.prediction Map

 By: cnbpjb (--GA) - 2006-05-15 @ 07:47:42

This is definitely the Democrats worse nightmare, and probably the best Republican chance. But very unlikely, mainly because highly unlikely Rendell will lose in Pennsylvania. I do believe some of these heavy GOP leaning maps, both with the Senate and Governorships are NOT taking into the recent (just yesterday) really horrible poll numbers for President Bush's popularity. And they need to get over that Bush is that popular (it makes them look like total computer trolls that are stuck inside a bunker somewhere 24/7 and that isn't at all realistic). And unless (and this is scary to think about, but unfortunately true), unless there is a major terrorist attack here in the U.S. many Republicans are either on the way out or won't get in (not that I think my map will necessarily the way it will play out, either, but I think I have more realism as to how the body politic really feels as of now).

Last Edit: 2006-05-15 @ 07:48:40
prediction Map

 By: texasgurl24 (D-NY) - 2006-06-10 @ 20:45:50

The eternal optimist. :)prediction Map

 By: downwithdaleft (R-NJ) - 2006-06-28 @ 11:56:22

To say this is impossible is ridiculous, he didn't pick states that have no chance of changing like Wyoming or New Hampshireprediction Map

 By: db099221 (--CA) - 2006-07-29 @ 21:15:46

You really shouldn't be this optimistic.prediction Map

 By: ryer (R-VA) - 2006-07-29 @ 23:54:43

Still, this map isn't quite the best possible result for the GOP. If it were, Colorado, Massachusetts, and Wisconsin would be colored blue. As of this writing, that would be the best possible result for the Republicans.prediction Map


User's Predictions

Prediction Score States Percent Total Accuracy Ver #D Rank#Pred
P 2014 Senate 32/36 20/36 52/72 72.2% pie 2 73 177T382
P 2012 President 53/56 44/56 97/112 86.6% pie 1 2 227T760
P 2012 Senate 32/33 18/33 50/66 75.8% pie 1 2 111T343
P 2012 Governor 10/11 6/11 16/22 72.7% pie 1 16 89T228
P 2012 Rep Primary 38/52 6/52 44/104 42.3% pie 2 - 98T231
P 2010 Senate 32/37 20/37 52/74 70.3% pie 5 45 181T456
P 2010 Governor 31/37 17/37 48/74 64.9% pie 2 291 188T312
P 2008 Dem Primary 45/52 23/52 68/104 65.4% pie 4 - 20T271
P 2008 Rep Primary 38/49 11/49 49/98 50.0% pie 7 - 55T235
P 2007 Governor 3/3 2/3 5/6 83.3% pie 1 170 58T167
P 2006 U.S. Senate 29/33 21/33 50/66 75.8% pie 4 35 156T465
P 2004 President 56/56 40/56 96/112 85.7% pie 7 4 34T1,994
Aggregate Predictions 399/455 228/455 627/910 68.9% pie


Back to 2006 Gubernatorial Prediction Home - Predictions Home


Terms of Use - DCMA Policy - Privacy Policy and Cookies

© Dave Leip's Atlas of U.S. Elections, LLC 2019 All Rights Reserved